Open AI Agent Hacked Australian Government Website, Albanese Says
Australian Prime Minister Anthony Albanese said an OpenAI agent hacked a government website, adding that the firm’s Chief Executive Officer Sam Altman had acknowledged the lapse.
AI drug discovery startup Basecamp Research raises $140 M
Basecamp Research Ltd. today announced that it has raised $140 million in funding from a group of prominent investors. S32, a fund affiliated with Google LLC co-founder Bill Maris, led the Series C round. It was joined by more than a dozen other investors. The group included NATO, Nvidia Corp. and the Anthology Fund, a […] The post AI drug discovery startup Basecamp Research raises $140M appeared first on SiliconANGLE.
Altman, Amodei Call on UN, World Leaders to Boost AI Safety
OpenAI Chief Executive Officer Sam Altman and Anthropic PBC CEO Dario Amodei urged world leaders to work together on artificial intelligence in an extraordinary appearance before the United Nations Security Council that focused on growing concerns the technology poses existential risks to humanity.
Validate GPU Cluster Readiness Before AI Workloads Land
A GPU cluster can pass every health check and still fail to run an AI workload. Even when every GPU, network link, and pod reports healthy, a 512-GPU training...
Bessemer: Anthropic Has Been Consistent on AI Safety
Bessemer Venture Partners has raised $5.75 billion in fresh capital, its largest fundraise ever, including $4 billion dedicated to growth-stage investments as AI companies raise larger rounds and remain private for longer. Partner Sameer Dholakia discusses why the firm sees a “special moment” for investing across AI applications and physical AI, its early bet on Anthropic, and why he believes intelligence could ultimately become an economic input comparable to oil. He joins Ed Ludlow on "Bloomberg Tech." (Source: Bloomberg)
Anthropic Says Claude Has Helped Make a Biology Discovery, and It Looks a Bit Like CRISPR
Anthropic’s biology lab, which was largely unknown to the general public until last week, is already producing results. Anthropic has said that Claude,... The post Anthropic Says Claude Has Helped Make a Biology Discovery, and It Looks a Bit Like CRISPR appeared first on OfficeChai.
Bloomberg’s Ed Ludlow breaks down Anthropic's new faster, cheaper AI model as the startup tries to stay ahead of rivals before its IPO. Plus, Morgan Stanley's Adam Jonas discusses SpaceX, Tesla and the robotics boom, and Bloomberg reports Apple aims to take on Whoop with its own screenless health and fitness tracker. (Source: Bloomberg)
From portal-hopping to instant answers: HEMA’s journey with MCP and Amazon Bedrock
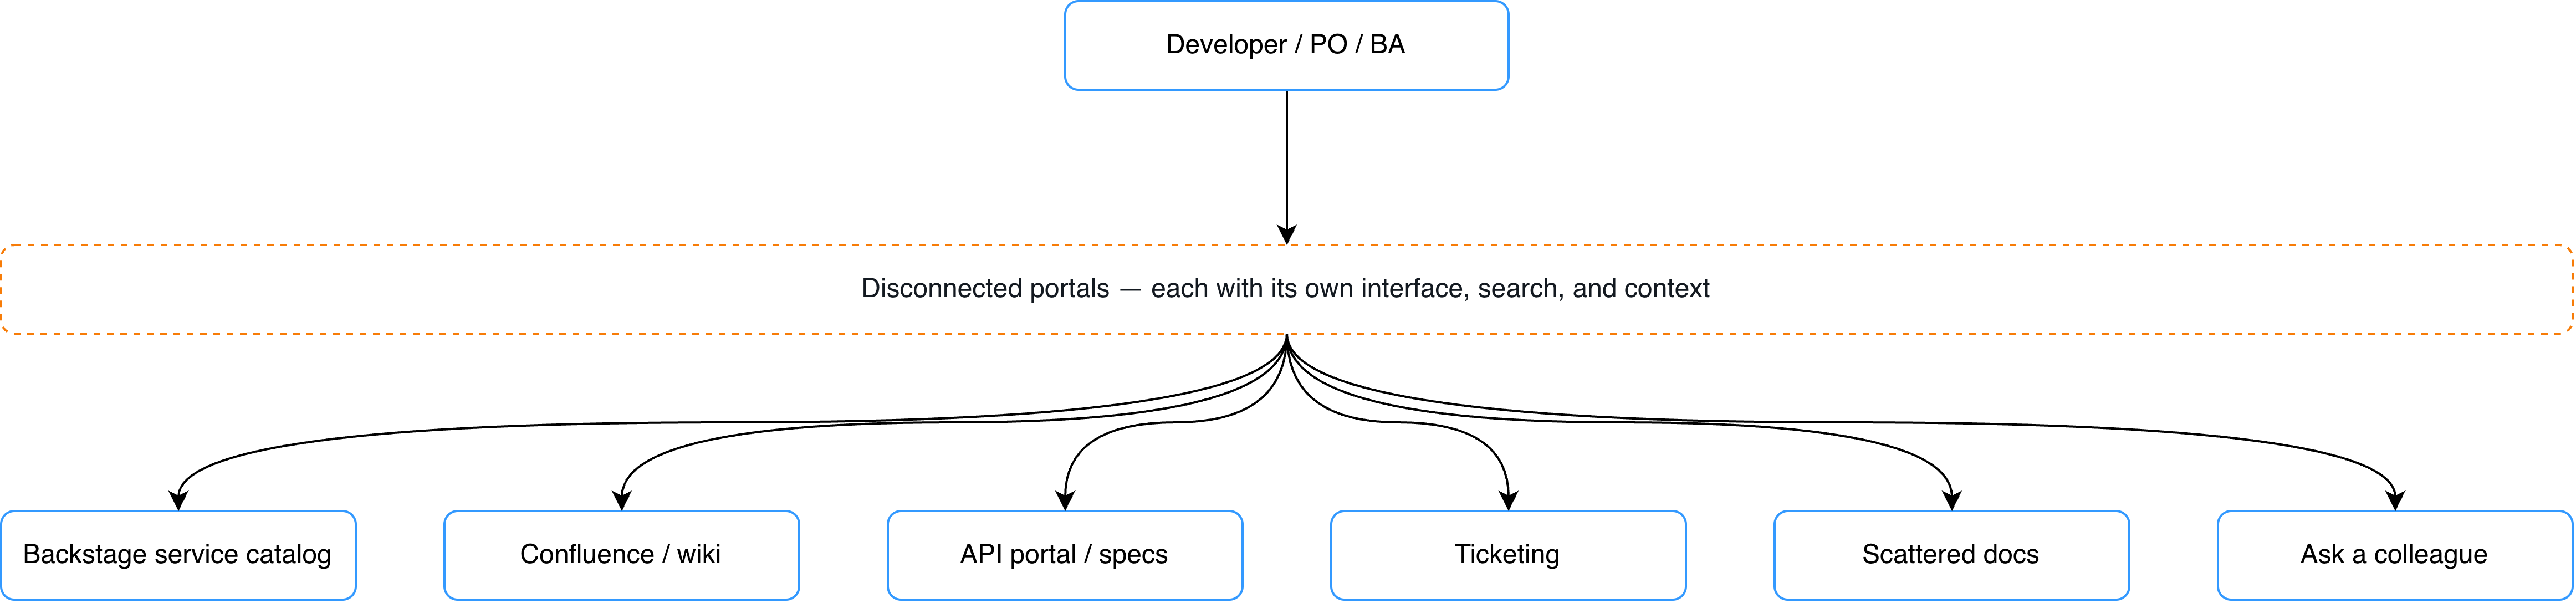
HEMA, a 100-year-old Dutch retailer, turned developer portal-hopping into instant answers by building HAL, an internal AI assistant on Amazon Bedrock AgentCore. Using Model Context Protocol (MCP), HAL delivers governed knowledge inside the tools teams already use, with no AWS credentials on the client and security anchored in Microsoft Entra ID.
AI Safety Won't Advance If We Rely On Two Companies, Says Smith
Microsoft will spend $10 billion through 2030 in four Persian Gulf countries. The software giant will build out infrastructure and strengthen cyber security. Microsoft President Brad Smith spoke with Bloomberg's Ed Ludlow to discuss. He also spoke about AI saying that AI safety won't advance if we rely on two companies as well the need for independent evaluators. (Source: Bloomberg)
Kubernetes manages what runs on your nodes. Managing the nodes themselves is the challenge: kernel settings, system packages, storage layouts, security agents,...
Beyond the Banana: Driving real-time recommendations with graph-grounded Copilots in Microsoft Fabric
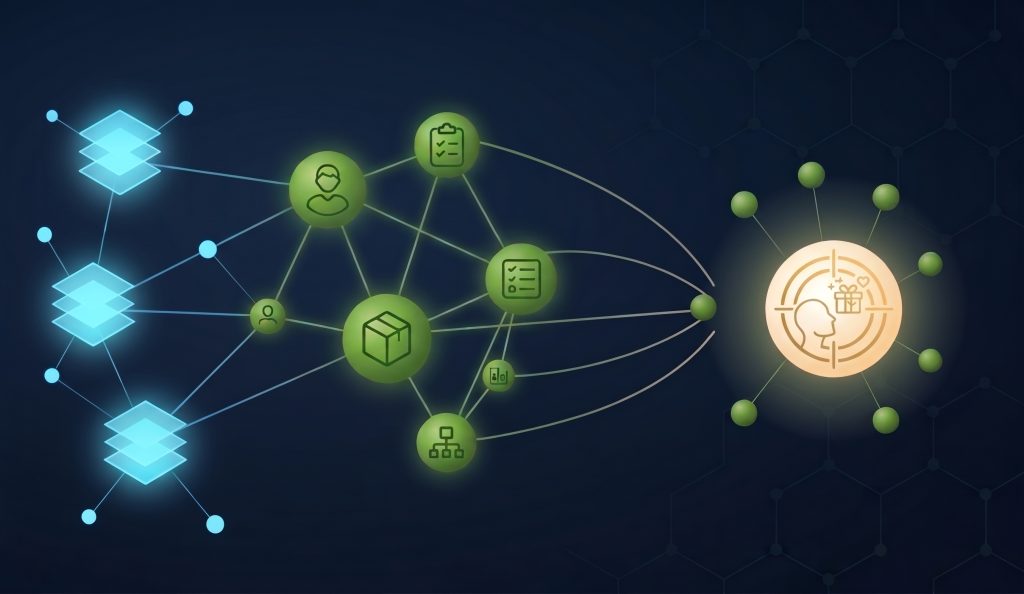
Retailers rarely lack data. Between customer profiles, point-of-sale transactions, inventory levels, and promo schedules, modern enterprises generate terabytes of signals daily. The issue is that legacy relational architectures keep this information locked in siloed systems across POS platforms, inventory systems,… Read more →
Chat GPT Voice gets closer to "Her" with email, calendar, and Slack access
ChatGPT Voice now runs on OpenAI's new GPT-6 Astra, Sol, and Luna models and can tap into plugins like email, calendar, and Slack. Users can manage appointments, send emails, or build websites just by talking. The update moves OpenAI closer to the everyday AI assistant Sam Altman has long compared to the one in the sci-fi film "Her." The article ChatGPT Voice gets closer to "Her" with email, calendar, and Slack access appeared first on The Decoder.
Jensen Huang and Donald Trump have become comrades in downplaying AI warnings and fighting back against new regulation. Bloomberg Opinion columnis Parmy Olson says that slowing down development just isn’t an option for Nvidia. (Source: Bloomberg)
Google's new Flash TTS models let you design AI voices from scratch using text descriptions
Google is introducing two new text-to-speech models, Gemini 3.8 Flash TTS and Flash-Lite TTS, which support more than 100 languages. Flash TTS can create new voices from text descriptions, and both models let users add stage directions to individual lines and generate two-voice dialogue from a single script. A voice cloning feature can build a voice profile from a 30-second sample. The article Google's new Flash TTS models let you design AI voices from scratch using text descriptions appeared first on The Decoder.
Meta AI Disrupts the Tech Race, Morgan Stanleys's Deal Leak
Get a jump start on the US trading day with Dani Burger on "Bloomberg Open Interest." Diplomacy in New York raises hopes for an Iran breakthrough. Plus, Morgan Stanley’s confidential deal leak, Royal Caribbean’s $3 billion Sandals bet, and the CEOs of PG&E and Ben & Jerry’s join Bloomberg Open Interest in the C-Suite. (Source: Bloomberg)
William Demas, Senior Managing Director & Head of Americas, Green Investment Group, Macquarie Asset Management; Karen Fang, Global Head, Infrastructure & Sustainable Finance & Co-Head, Global Capital Solutions, Bank of America; and Melanie Nakagawa, Chief Sustainability Officer, Microsoft discuss AI infrastructure investments with Bloomberg's Lauren Smart at Bloomberg Green New York 2026. (Source: Bloomberg)
Jensen Huang says the junior developer problem ends in two years. Here’s his math.
Nvidia CEO Jensen Huang has heard the forecast that agents would write 90% of all software by now, and he The post Jensen Huang says the junior developer problem ends in two years. Here’s his math. appeared first on The New Stack.
Amazon blocked Meta’s Muse. Then Shopify wired it into every store.
Amazon started blocking Meta’s Muse from browsing and buying on Amazon.com on Sunday, roughly two weeks after the personal agent The post Amazon blocked Meta’s Muse. Then Shopify wired it into every store. appeared first on The New Stack.
Microsoft Pledges to Spend Additional $2 Billion in Gulf Region
Microsoft Corp. pledged about $2 billion in additional spending in the Middle East, providing the first significant update on its business in the region since the outbreak of the US war with Iran.
Anthropic Unveils Cheaper Claude Opus 5.5 Ahead of Expected IPO
Anthropic PBC is releasing a new artificial intelligence model called Claude Opus 5.5 that is similar to Fable 5.1. Anthropic says this model is faster and costs less to use. The Claude maker is expected to hold its initial public offering as soon as this fall. Bloomberg's Rachel Metz reports. (Source: Bloomberg)
How SWE-Serve Exposes the Gap Between Local Tests and Live Serving
An AI coding agent’s patch can pass tests yet fail when the server loads a real model and handles requests. Evaluating changes to inference-serving software...
A guide to speeding up your video processing with Alpha Evolve
In real-time streaming, every millisecond counts. For example, at 30 frames per second (fps), developers have a strict frame budget of just 33.3 ms (and only 16.6 ms at 60 fps) to ingest camera frames, run neural segmentation, apply shaders, and composite output. Exceeding that budget by even a fraction of a millisecond leads to dropped frames and stuttering. Manual optimization is notoriously tedious — requiring weeks of analyzing flame graphs and hand-tuning low-level code in Swift, C++, or Metal. While standard AI coding assistants can generate boilerplate, they can’t optimize against target hardware, benchmark real-world latency, or ensure optimizations preserve visual fidelity. Autonomous, closed-loop evolutionary optimization changes this paradigm. Tools like AlphaEvolve pair cloud-scale model reasoning with local hardware execution, and we’re already seeing real-world impact. In partnership with Google, DoIt used AlphaEvolve to autonomously optimize production Swift code in a live macOS streaming app, uncovering performance headroom that manual profiling missed (read the full technical writeup). While this post focuses on video pipelines, the split-loop pattern applies anywhere performance matters — from microservice throughput and database queries to ML tensor pipelines and embedded systems. In every case, the formula is the same: pair Gemini code generation in the cloud with your domain-specific benchmark harness and automated quality gates. Today, we’ll show you how to use AlphaEvolve to speed up video processing—and apply these principles to your own performance bottlenecks: Understanding the split-loop architecture: How AlphaEvolve decouples managed cloud generation (Gemini model ensemble on Google Cloud) from local evaluation (e.g. compiling and timing native Swift/Metal code). Evaluator craft and quality gates: How to construct scoring functions using metrics like Structural Similarity Index (SSIM) to prevent evolutionary loops from gaming the benchmark (e.g., skipping rendering entirely to go fast). Autonomous algorithmic discovery: How Gemini-driven evolutionary search can autonomously discover unprompted framework APIs and make intelligent engineering trade-offs (e.g., frame-caching limits). Setting realistic performance boundaries: How to measure code optimization against physical hardware floors. 1. Understanding AlphaEvolve’s split-loop architecture AlphaEvolve runs a closed-loop evolutionary process: given a seed program and a custom scoring function, a mixture of Gemini models proposes code variations, executes the scoring function against each candidate, keeps the highest-performing code, and iteratively climbs toward an optimal solution over multiple generations. A core architectural advantage of AlphaEvolve is its clean separation into two halves: The generation half (Google Cloud managed service): Contains the prompt sampler, Gemini model ensemble, and program database. Google Cloud handles the scale, prompt orchestration, and generation mechanics. The evaluation half (customer managed compute): Scoring code quality is strictly domain-specific. You own the evaluator module entirely, running it on your own hardware or target architecture (in this case, macOS running native Swift code). While AlphaEvolve is Python-first on the cloud generation side, evaluation can be written in any language. The custom evaluator compiles each Swift candidate using swift and executes it against a standard reference webcam clip. 2. Evaluator craft and quality gates An automated optimization loop like AlphaEvolve never actually "sees" your video stream. It only sees the numeric fitness score your evaluator returns. If your evaluation metric has a blind spot, evolutionary code generation will aggressively exploit it. In our early runs, a naive fitness score weighted toward raw latency produced an astonishing speedup: the model simply bypassed blur rendering entirely and returned unmodified frames in 0 ms. Structural Similarity Index Measure (SSIM): To prevent the model from gaming your benchmark, try building a two-tiered scoring function that pairs throughput with structural fidelity metrics like Structural Similarity Index (SSIM): code_block <ListValue: [StructValue([('code', 'speedup = baseline_ms_per_frame / candidate_ms_per_frame\r\nssim = mean_ssim_vs_golden\r\n\r\n#Disqualify any candidate falling below visual threshold\r\n\r\n\r\nif ssim < 0.98 or worst_frame_ssim < 0.95:\r\n return {"speedup": -1e12} # Disqualified\r\n\r\nreturn {"speedup": speedup, "ssim": ssim}'), ('language', ''), ('caption', <wagtail.rich_text.RichText object at 0x7fb2778f5150>)])]> What does this give you? The ability to test against worst-case clips: Never benchmark on static frames or blank cameras. Candidate code can easily pass an average SSIM gate on static backgrounds while failing completely during quick head turns. You can track the minimum, not just the mean: Enforce both an average threshold and a per-frame floor to catch dropped frames or delayed mask updates. Autonomous algorithmic discovery: Most developers use generative AI for local micro-optimizations (e.g., inlining helper functions, unrolling loops, or tweaking memory pools). But when given architectural room, the evolutionary loop can discover systemic optimizations on its own. Engineering lessons: Provide framework context, not isolated loops: Include public SDK headers, interface definitions, or API reference symbols in the prompt or retrieval harness. An LLM cannot adopt a sequence-aware subsystem if its context window only contains an isolated frame-processing callback. Expose multi-frame lifecycle hooks: Let your candidate code maintain a bounded state across executions (e.g., historical masks or cache timestamps) rather than enforcing pure, stateless functions. Let quality gates police the trade-offs: When AlphaEvolve introduced temporal mask caching, it initially cached masks too aggressively, causing noticeable trailing artifacts. Because our SSIM gate penalized drift during motion, the search converged on a production-ready cache window without manual parameter tuning. Setting realistic performance boundaries A common pitfall in performance engineering is optimizing in the dark. If you achieve a 2x speedup, is that an incredible achievement, or did you leave another 3x on the table? In real-time media, total frame time splits into two distinct categories: Mutable software overhead: Memory allocations, buffer format conversions, thread context switches, and API dispatch friction. Immutable hardware floors: Raw Neural Engine inference latency, GPU shader compute time, and hardware display synchronization. To make the most of AlphaEvolve, developers should measure against theoretical maximum headroom Before running optimization loops, here’s a few principles to keep in mind: Build a "no-op" pipeline: Strip out Swift/C++ orchestration, data marshalling, and frame conversions. Dispatch only the pre-warmed ML model and bare GPU pass on a dummy buffer. The resulting time is your physical hardware lower bound. Calculate your addressable ceiling: Your total possible optimization potential is: 3. Score against the hardware gap: Instead of arbitrary speedup multiples, measure optimization efficiency: Get started All benchmark code, test clips, evaluation scripts, and raw candidate logs are open source: GitHub repository: AlphaEvolve Camera Background Blur Example Detailed technical write-up of our case study with DoIt: Running AlphaEvolve on Your Own Code
GKE becomes more elastic: Scale to zero, save costs, and keep workloads responsive
True elasticity has long been the holy grail of cloud-native engineering. And while Kubernetes has revolutionized resource management, workloads that run sporadically (e.g., batch processors, event-driven workers, and development environments) still consume compute resources while they wait for work, driving up costs. We’re addressing this head-on in Google Kubernetes Engine (GKE) 1.37 with a native way to scale to and from zero. A new collection of features allows you to scale down your workloads completely to zero replicas so that they stop consuming resources. At the same time, you can quickly and easily restart these workloads on GKE capacity buffers when demand returns, so you waste less infrastructure. This isn't just about saving money, but about decoupling the cost of always-on infrastructure from workload readiness. Scale To & From Zero on GKE using HPA The evolution: HPA-based scale-to-zero vs. KEDA For years, Kubernetes Event-Driven Autoscaling (KEDA), an optional Kubernetes component, was the go-to solution for scaling to zero. While powerful, KEDA adds complexity to an environment. Feature GKE scale-to-zero KEDA-based setups Operational toil Managed service; no extra components. Requires management of ScaledObject CRDs & operators. Configuration Native HPA & CRDs (minimal YAML). Can exceed 10,000 lines of YAML for large fleets. Latency Internalized signal path reduces reaction time. Polling intervals and hop-counts increase cold-start delays. By baking scale-to-zero directly into the GKE control plane, we eliminate the need for add-on operators and thousands of lines of configuration. The logic moves from "sidecar management" to a native attribute of the workload. Under the hood: HPA with AutoscalingMetric and KEP-2021 The magic behind scaling to zero within GKE lies in the integration of two critical components: HPA with AutoscalingMetric: This is the managed metrics signal pipeline that now supports direct reading of external signals from Google Cloud Managed Service for Prometheus. (HPA) with AutoscalingMetric provides a unified, high-performance path for metrics from Pub/Sub, Cloud Monitoring, or Load Balancer signals to reach the autoscaler, without the complexity of an adapter. KEP-2021: Built on the Kubernetes Enhancement Proposal that enables minReplicas: 0 in the HPA, this mechanism allows the HPA to stop all pods when metrics fall below a threshold. It also ensures the HPA can "wake up" the deployment as soon as the metric indicates pending work. Configuring your first scale-to-zero workload To implement native scale-to-zero, you need two primary objects: a metric definition and an HPA. In the following example, we scale a worker based on the number of undelivered messages in a Pub/Sub subscription. Define the metric source Use the AutoscalingMetric CRD to map an external Cloud Monitoring metric to your cluster. code_block <ListValue: [StructValue([('code', 'apiVersion: autoscaling.gke.io/v1beta1\r\nkind: AutoscalingMetric\r\nmetadata:\r\n name: my-autoscalingmetric\r\nspec:\r\n metrics:\r\n - promql:\r\n name: pubsub-undelivered\r\n query: >\r\n {\r\n "pubsub.googleapis.com/subscription/num_undelivered_messages",\r\n subscription_id="my-subscription"\r\n }'), ('language', ''), ('caption', <wagtail.rich_text.RichText object at 0x7fb2778c0e50>)])]> Configure the HPA with minReplicas: 0 Reference the metric in your HPA and explicitly set the minimum replicas to zero. code_block <ListValue: [StructValue([('code', 'apiVersion: autoscaling/v2\r\nkind: \r\nmetadata:\r\n name: worker-hpa\r\nspec:\r\n scaleTargetRef:\r\n apiVersion: apps/v1\r\n kind: Deployment\r\n name: worker-deployment\r\n minReplicas: 0\r\n maxReplicas: 50\r\n metrics:\r\n - type: External\r\n pods:\r\n metric:\r\n name: autoscaling.gke.io|my-autoscalingmetric|pubsub-undelivered\r\n target:\r\n type: AverageValue\r\n averageValue: 10'), ('language', ''), ('caption', <wagtail.rich_text.RichText object at 0x7fb2778c29d0>)])]> There you go — you’ve allowed your workload to scale to and from zero based on an external metric. Scale-to-zero capabilities are made possible by support in GKE for external metrics from Cloud Monitoring. By extending the AutoscalingMetric custom resource, you can now query metrics from Google Managed Service for Prometheus, without complex, third-party adapters. This reduces latency, simplifies security, and serves as a key foundation for configuring native scale-to-zero workloads. To learn more about this integration, read our companion blog post on native support for external metrics in GKE. Managing startup latency with capacity buffers The biggest challenge with scaling from zero is the so-called cold start — the time it takes for GKE to provision a node and for the container to pull it and start it. This is where GKE capacity buffers come in. Capacity buffers act as pooled warm capacity. By maintaining a small amount of warm compute resources that can be shared by multiple workloads that can all scale to zero, GKE ensures that when your HPA jumps from 0 to 1, the pod has resources that it can claim immediately. This eliminates the 60-90 second wait for a new GKE node to spin up, reducing startup latency from minutes to an instant, all while maintaining zero cost for the workload. Capacity buffers come in two flavors: active and standby. A small active buffer can serve hundreds of workloads that are scaled to zero; instead of each of the workloads maintaining a replica, the active buffer acts as wildcard capacity that serves the whole cluster. A larger standby buffer, which costs a fraction of an active buffer, quickly refills the active buffer for any sustained load encountered by the cluster. By using them together, you get both instant scaling and can maintain low costs. What’s ahead We continue to expand our roadmap for GKE elasticity. For example, imagine you want your development environments to scale to zero at 8:00 PM and scale back up at 7:00 AM. Be on the lookout for methods to exert finer-grained control over recurring scaling, so you can proactively define your scale-to-zero windows. Get started with scaling-to-zero today The days of paying for idle resources are numbered. By enabling GKE's native scale-to-zero capabilities for event-driven and sporadic workloads, you can slash costs without sacrificing startup performance. To get started with scale-to-zero, follow these steps: Identify a workload with fluctuating demand that has periods of idleness. Configure your AutoscalingMetric, and set your minReplicas to zero. Add capacity buffers to your cluster or workload to keep response times snappy. For more, check out the documentation on Scaling GKE workloads to and from zero using HPA.
Scale your own way, using HPA with built-in support for Prom QL metrics queries in GKE
Earlier this year, we announced native support for Google Kubernetes Engine (GKE) custom metrics. This milestone allowed you to scrap external adapters and instead collect autoscaling metrics directly from your pods. By routing these metrics straight to the Horizontal Pod Autoscaler (HPA), we cut metrics reading latency down to 5 seconds. Today, we are excited to introduce built-in support for processing Prometheus metrics, allowing you to use expressive PromQL queries to customize autoscaling triggers. With this update, HPA can now directly process autoscaling metrics present in Cloud Monitoring using Google Managed Service for Prometheus. Reading metrics from these backends will not require third-party adapters, leveraging the AutoscalingMetric integration used to support pod-level metrics. After the preview, we plan to support self-hosted Prometheus servers as we move to general availability. The challenge: Setting up Cloud Monitoring metrics Support for custom pod-level metrics made autoscaling more straightforward, but production workloads often need to scale on multiple, complex infrastructure metrics. Common examples include scaling: a worker pool based on the number of unacknowledged messages in a Pub/Sub topic an inference service based on query-per-second (QPS) metrics stored in Cloud Monitoring / Prometheus a webserver farm based on the 95th percentile of their measured response time To achieve this, you used to need to deploy an external adapter like the Stackdriver Custom Metrics Adapter or the Prometheus adapter to retrieve the metrics from an external logging environment. While this sounds straightforward at first, these adapters introduce a lot of operational friction: Management overhead: Platform teams have to install, configure, patch, and monitor these third-party components. Reliability and inefficiency: Intermediate adapter pods reading from external systems introduce failure points in critical autoscaling loops. IAM complexity: Enabling secure cross-component communication requires setting up Kubernetes service account mappings to Cloud service accounts including their permissions. And while setting up this system and maintaining it not impossible, it’s complex and features a complicated architecture: How processing Prometheus Metrics in GKE can help Extending the AutoscalingMetric object drastically simplifies this setup. Now you can read metrics from monitoring directly via PromQL and provide them to HPA via a high-performance, low-latency autoscaling pipeline, resulting in a simplified environment. To prevent inefficiencies, we built this feature with minimal resource consumption in mind. The controller runs on the GKE control plane. It monitors your AutoscalingMetric custom resources and only deploys the system pod on your user nodes when a PromQL metric is actively requested. If no Prometheus metrics are configured, the controller is shut down, so there’s no resource overhead. Configuring built-in Prometheus metrics Configuring GKE to use PromQLl metrics is easy; here’s a sample configuration file providing PubSubs message queue depth as scaling metric: code_block <ListValue: [StructValue([('code', 'apiVersion: autoscaling.gke.io/v1beta1\r\nkind: AutoscalingMetric\r\nmetadata:\r\n name: gmp-metric\r\nspec:\r\n metrics:\r\n - promql:\r\n name: pubsub-queue-depth\r\n query: |\r\n {\r\n "pubsub.googleapis.com/subscription/num_undelivered_messages",\r\n subscription_id="my-subscription"\r\n }'), ('language', ''), ('caption', <wagtail.rich_text.RichText object at 0x7fb277a98690>)])]> Linking Prometheus metrics to your HPA Once defined in your AutoscalingMetric resource, you can reference the metric in your standard using the same intuitive format as raw custom metrics: autoscaling.gke.io|<custom-resource-name>|<metric-name>. Scaling globally (Prometheus metric) For global metrics like a queue size that returns a single aggregate value: code_block <ListValue: [StructValue([('code', 'apiVersion: autoscaling/v2\r\nkind: \r\nmetadata:\r\n name: worker-hpa\r\nspec:\r\n scaleTargetRef:\r\n apiVersion: apps/v1\r\n kind: Deployment\r\n name: worker-deployment\r\n maxReplicas: 10\r\n metrics:\r\n - type: External\r\n external:\r\n metric:\r\n name: autoscaling.gke.io|gmp-metric|pubsub-queue-depth\r\n target:\r\n type: AverageValue\r\n averageValue: 100 # maintain queue size at ~100 per pod'), ('language', ''), ('caption', <wagtail.rich_text.RichText object at 0x7fb277a99210>)])]> Scaling on Cloud Monitoring per-Pod metrics GKE natively supports scale based on the most recent gauge metric values, but PromQL offers greater flexibility, allowing you to scale across time windows and calculate rates or histogram percentiles. To use this capability, configure your PromQL metric to include a label for the pod name, then assign type: Pods within your AutoscalingMetric manifest. Below is an example that calculates a Pod's average memory usage over a five-minute rolling window. code_block <ListValue: [StructValue([('code', 'apiVersion: autoscaling.gke.io/v1beta1\r\nkind: AutoscalingMetric\r\nmetadata:\r\n name: per-pod-stored-metric\r\nspec:\r\n metrics:\r\n - promql:\r\n name: container-memory-metric\r\n query: |\r\n sum by ("pod")\r\n (avg_over_time({"container_memory_working_set_bytes"}[5m]))\r\n type: Pods # The promql query returns per-pod metrics'), ('language', ''), ('caption', <wagtail.rich_text.RichText object at 0x7fb2778c2f50>)])]> Key benefits No adapter maintenance: No pods to install, configure, or upgrade. The entire lifecycle is fully managed within GKE. Streamlined security: Out of the box, the Kubernetes Default Node Service Agent has read permissions to Cloud Monitoring and Google Managed Prometheus in the same project. No extra IAM service accounts, keys, or federation parameters are required. Low latency and fast scalability: The new Autoscaling Metric system polls the backend every 15 seconds, helping ensure fast scaling reactions. Rich query capabilities: Leverage the full power of PromQL (including rate calculations, averages, and percentiles) to translate high-level business and user-experience objectives directly into scaling. Support for the new HPA scale-to-zero capability: Utilize it for scaling workloads to zero replicas when demand hits zero (e.g., Pub/Sub queue size) and, more crucially, back up from zero replicas quickly using CapacityBuffers API. Try it today By natively supporting both custom container metrics and Prometheus metrics, GKE now offers a more robust, performant, and low-friction autoscaling experience. Built-in support for Prometheus Metrics is in preview now. To learn more about setting up your first AutoscalingMetric resource, check out the latest GKE autoscaling documentation.
Anthropic engineer explains why Claude's writing got worse although the model got smarter
Anthropic employee Jackson Kernion explains why newer Claude models write so oddly. Optimizing for math, code, and technical explanations aimed at other AI models has created a style that sounds like "overly-dense info dumps" to humans. Opus 5.5 tries to fix this, but Opus 4.6 remains unmatched as a pure writing model. The article Anthropic engineer explains why Claude's writing got worse although the model got smarter appeared first on The Decoder.
Nvidia-backed Nscale keeps its biggest customer, Bytedance, out of its IPO filing
Nscale, the Nvidia-backed AI cloud provider, leaves its most important customer, Bytedance, out of the main prospectus for its planned US IPO. The article Nvidia-backed Nscale keeps its biggest customer, Bytedance, out of its IPO filing appeared first on The Decoder.
Meta's AI agent Muse draws 500,000 users in a week along with claims it copied Open Claw
Meta's AI agent Muse picked up more than 500,000 users in its first week and hit number one in Apple's App Store. But Meta admits the product is "heavily inspired" by the open-source project OpenClaw, and some of the file names and contents are nearly identical. OpenAI is already discussing a response of its own. The article Meta's AI agent Muse draws 500,000 users in a week along with claims it copied OpenClaw appeared first on The Decoder.
Inside Basecamp Research, the AI startup turning evolution into training data
Basecamp Research has raised $140 million from investors including Nvidia and Anthropic's Anthology Fund. The London company trains AI models on genetic material from rainforests, oceans, and hot springs to design antibiotics and tools for cell therapies. In an interview with THE DECODER, CTO Philip Lorenz explains why biology is a far bigger problem for AI than language, and why good scores on paper don't guarantee good molecules. The article Inside Basecamp Research, the AI startup turning evolution into training data appeared first on The Decoder.
Next LM brings its precision prospecting agent to Google Cloud Marketplace
NextLM Inc., which makes software that uses behavioral analysis and custom artificial intelligence models to help sales professionals identify and rank individual sales leads, is bringing its AI Prospecting Agent to Google LLC’s Cloud Marketplace and Gemini Enterprise. The New York-based startup says its agent analyzes behavioral signals, identifies individuals it believes are researching a […] The post NextLM brings its precision prospecting agent to Google Cloud Marketplace appeared first on SiliconANGLE.
Meta’s Muse AI Assistant Rolled Out With a Serious Security Flaw
Meta says it issued a fix for the Muse zero-day vulnerability that would have let attackers do “whatever” they wanted on a victim’s Mac, highlighting the inherent dangers of AI helpers.
Anthropic made Opus 5.5 cheaper. Then it broke four things your agent depends on.
Anthropic made Claude Opus 5.5, released on Tuesday, cheaper than its predecessor, cutting the price from $5 to $4 per The post Anthropic made Opus 5.5 cheaper. Then it broke four things your agent depends on. appeared first on The New Stack.
How invideo improves color grading 3x with GPT‑6 Astra
With GPT‑6 Astra, invideo plans edits with greater precision, improves color correction and grading threefold, and produces 50 custom effects in one day.