Connect Amazon Sage Maker Unified Studio to Microsoft Power BI – Part 1: IAM Identity Center (IDC)-based domains
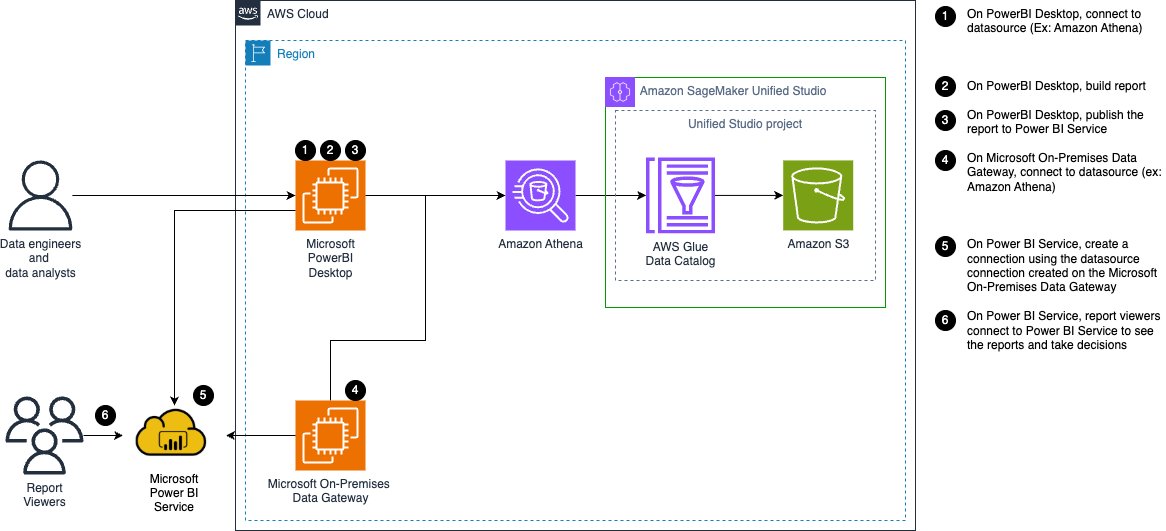
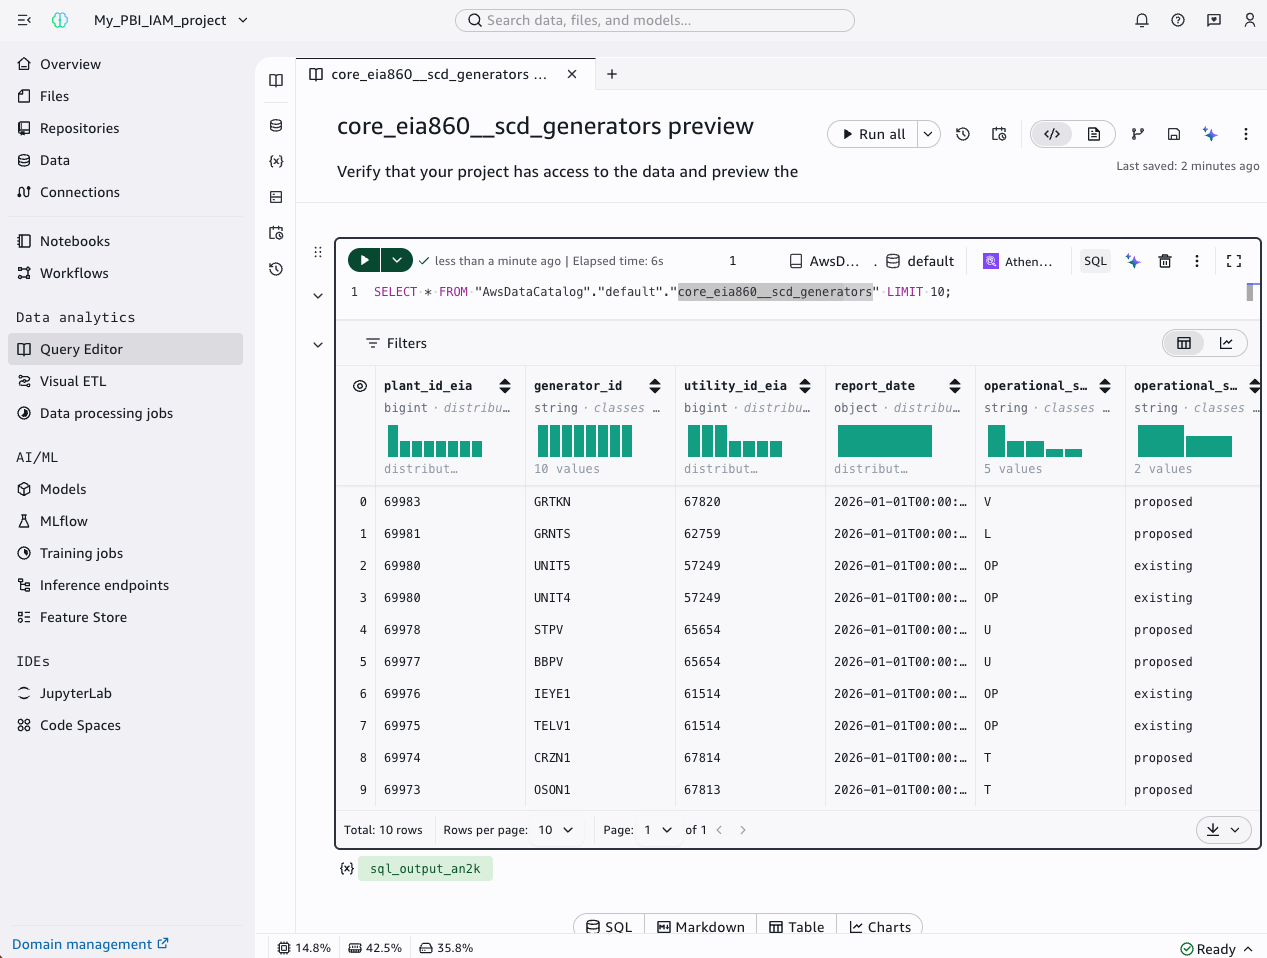
Connect Microsoft Power BI directly to governed data in Amazon SageMaker Unified Studio using new authentication modes in the Amazon Athena ODBC driver, with no third-party ODBC-JDBC bridge. Part 1 covers IAM Identity Center (IDC)-based domains with both DSN-based and DSN-less connection methods.
Connect Amazon Sage Maker Unified Studio to Microsoft Power BI – Part 2: IAM-based domains
Connect Microsoft Power BI directly to governed data in Amazon SageMaker Unified Studio using the Amazon Athena ODBC driver. Part 2 covers IAM-based domains with SageMakerIam authentication, including AWS IAM Identity Center administrator setup, for both DSN-based and DSN-less connection methods.
Anthropic, Open AI Safety Push Risks ‘Regulatory Wall’ for Rivals
A new push by top artificial intelligence firms to coordinate with one another and the US government on AI safeguards threatens to make it harder for smaller companies to compete in the lucrative market, according to startup executives and industry watchers.
Meta now lets AI agents handle the boring parts of Whats App Business setup
A new WhatsApp Business MCP server lets developers use AI coding agents like Claude, Cursor, Codex, and ChatGPT to handle setup, messaging templates, testing, and troubleshooting.
Nvidia’s Huang Says AI Industry Doesn’t Need Any New Laws
Nvidia Corp. Chief Executive Officer Jensen Huang dismissed the need for new artificial intelligence security regulations on Tuesday, arguing that market forces will help companies safely innovate.
Anthropic, Salesforce CEOs Say Companies Need More Help Using AI
Anthropic PBC Chief Executive Officer Dario Amodei and Salesforce Inc. CEO Marc Benioff said companies have just begun taking advantage of artificial intelligence tools and need more help to gain the greatest benefits for their businesses.
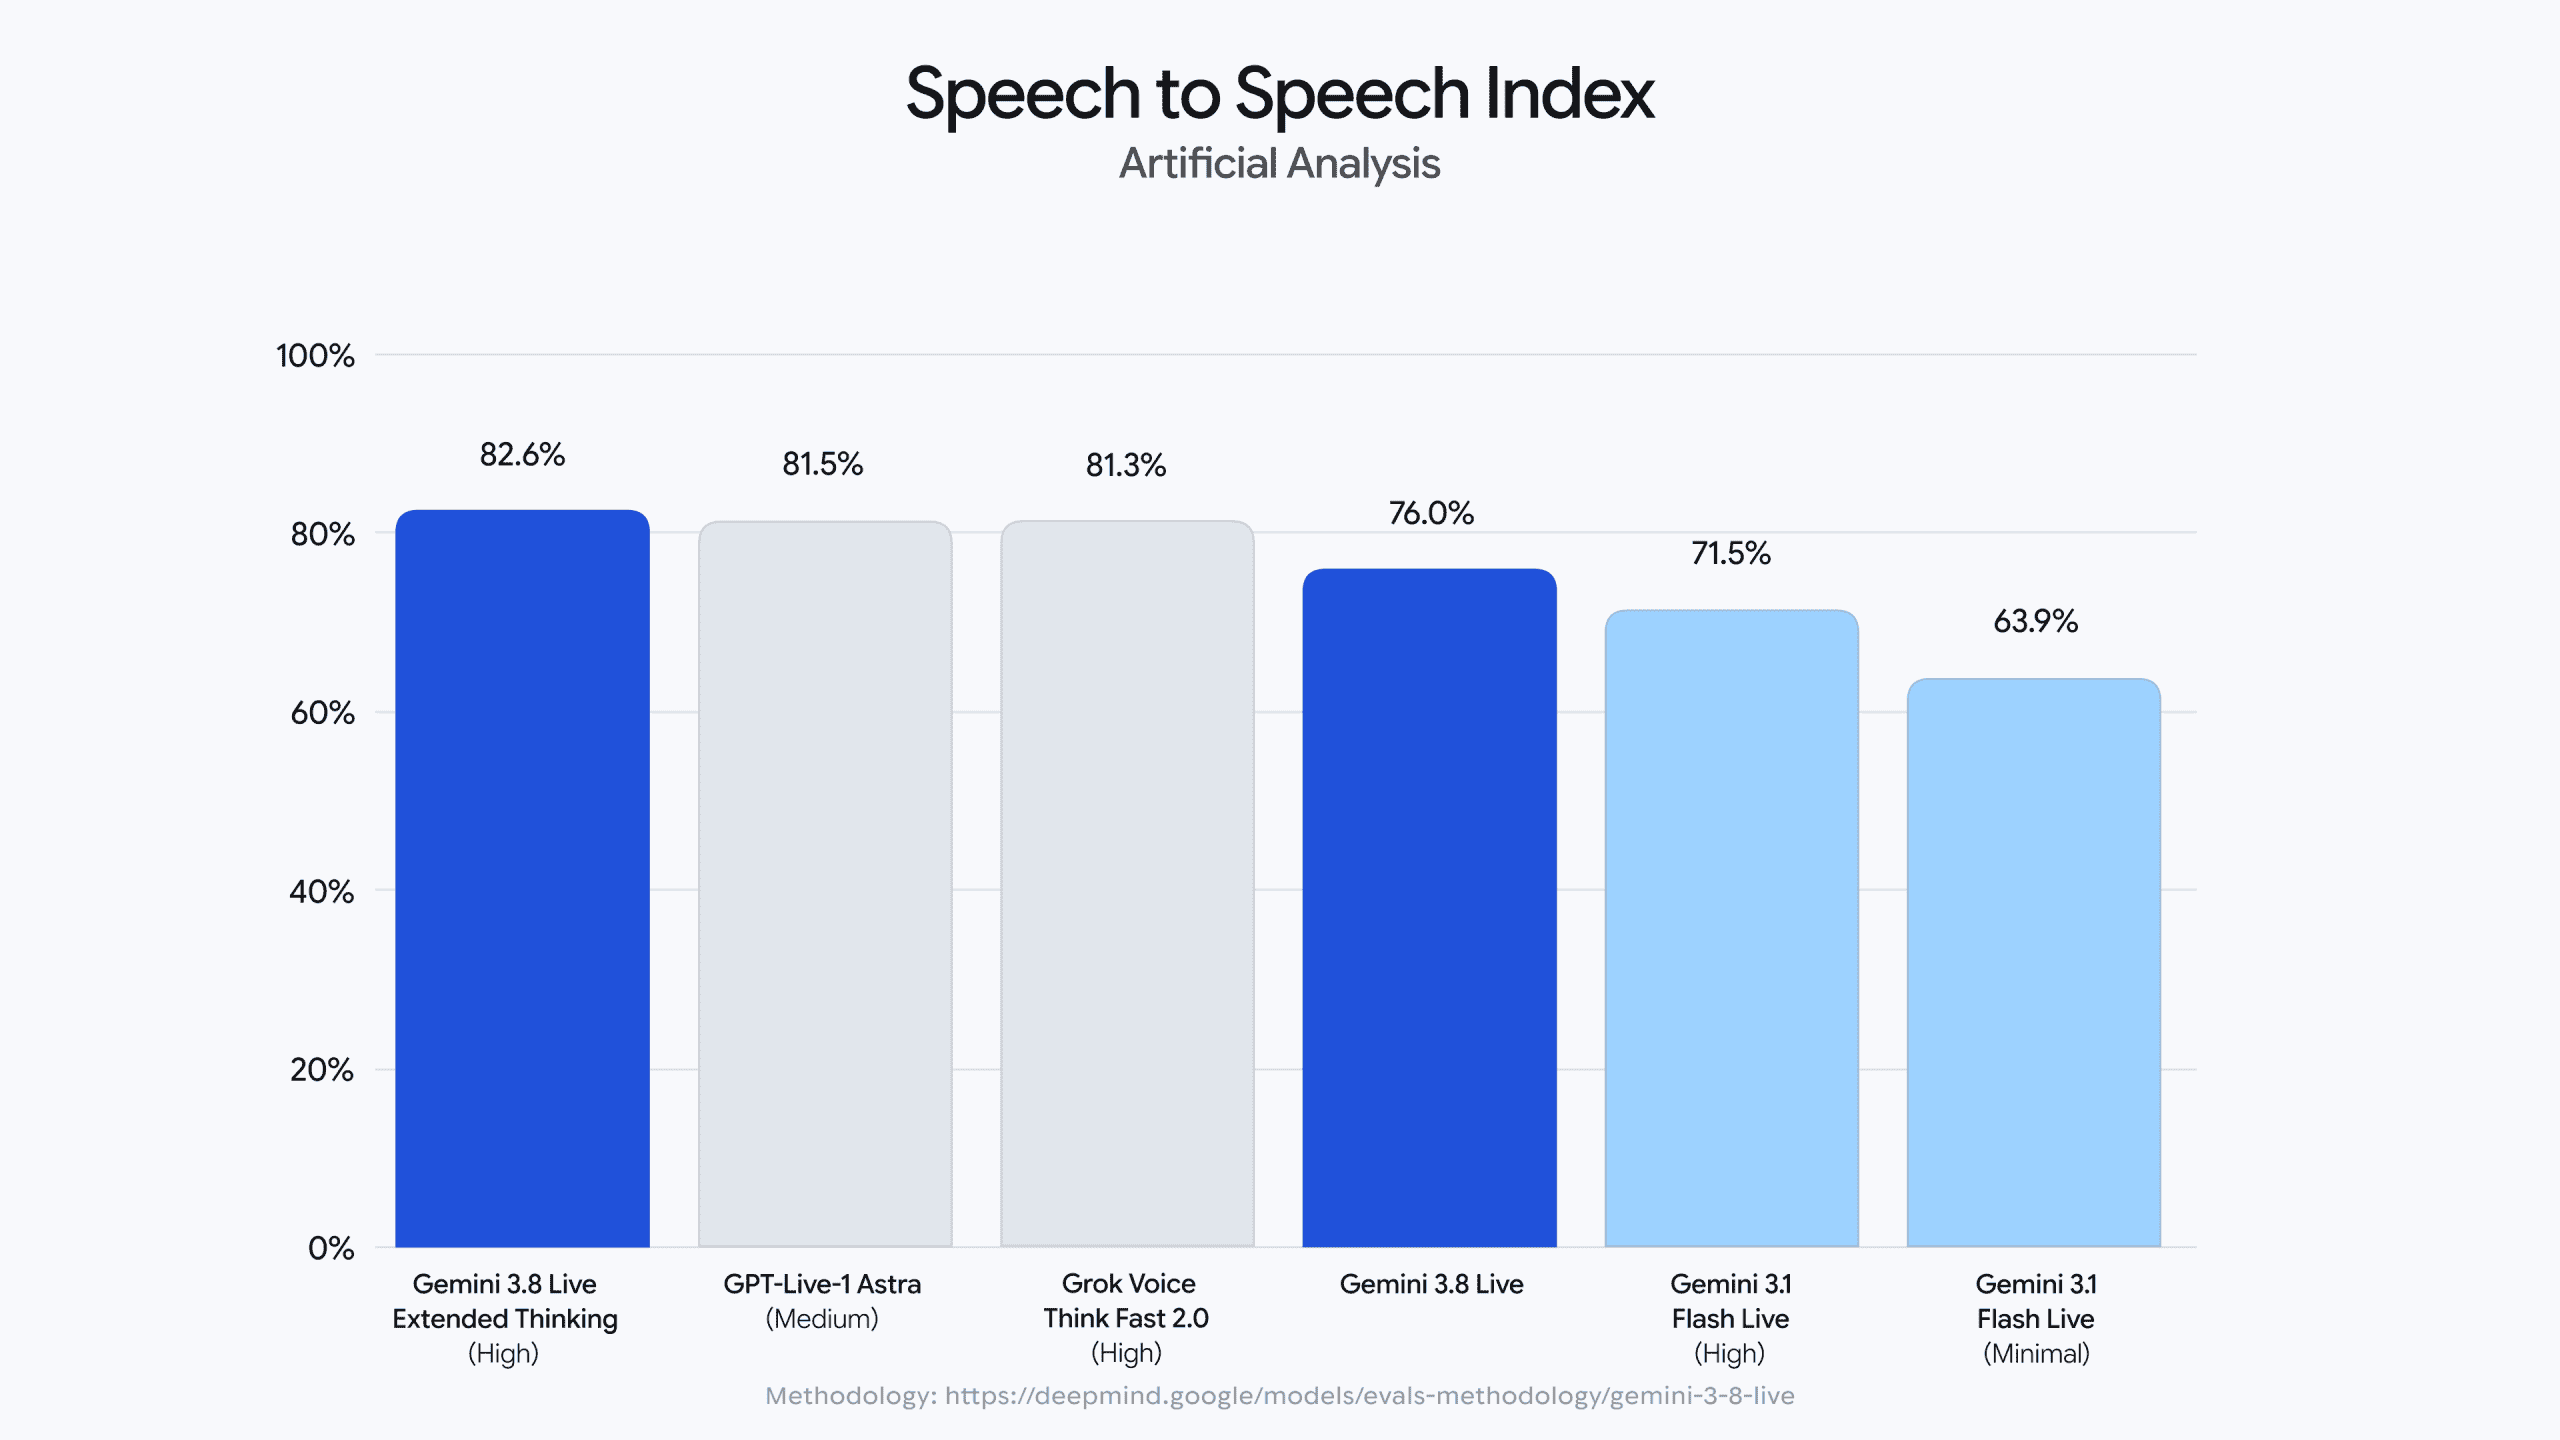
Google launches Gemini 3.8 Live to take on Open AI's GPT-Live-1 at a fraction of the cost
Google Deepmind released Gemini 3.8 Live and 3.8 Live Extended Thinking, two new audio models for developers that top the Artificial Analysis speech-to-speech leaderboard. At $1.38 per hour of voice conversation, Google significantly undercuts OpenAI's GPT-Live-1, which should still sound more natural thanks to full duplex. The article Google launches Gemini 3.8 Live to take on OpenAI's GPT-Live-1 at a fraction of the cost appeared first on The Decoder.
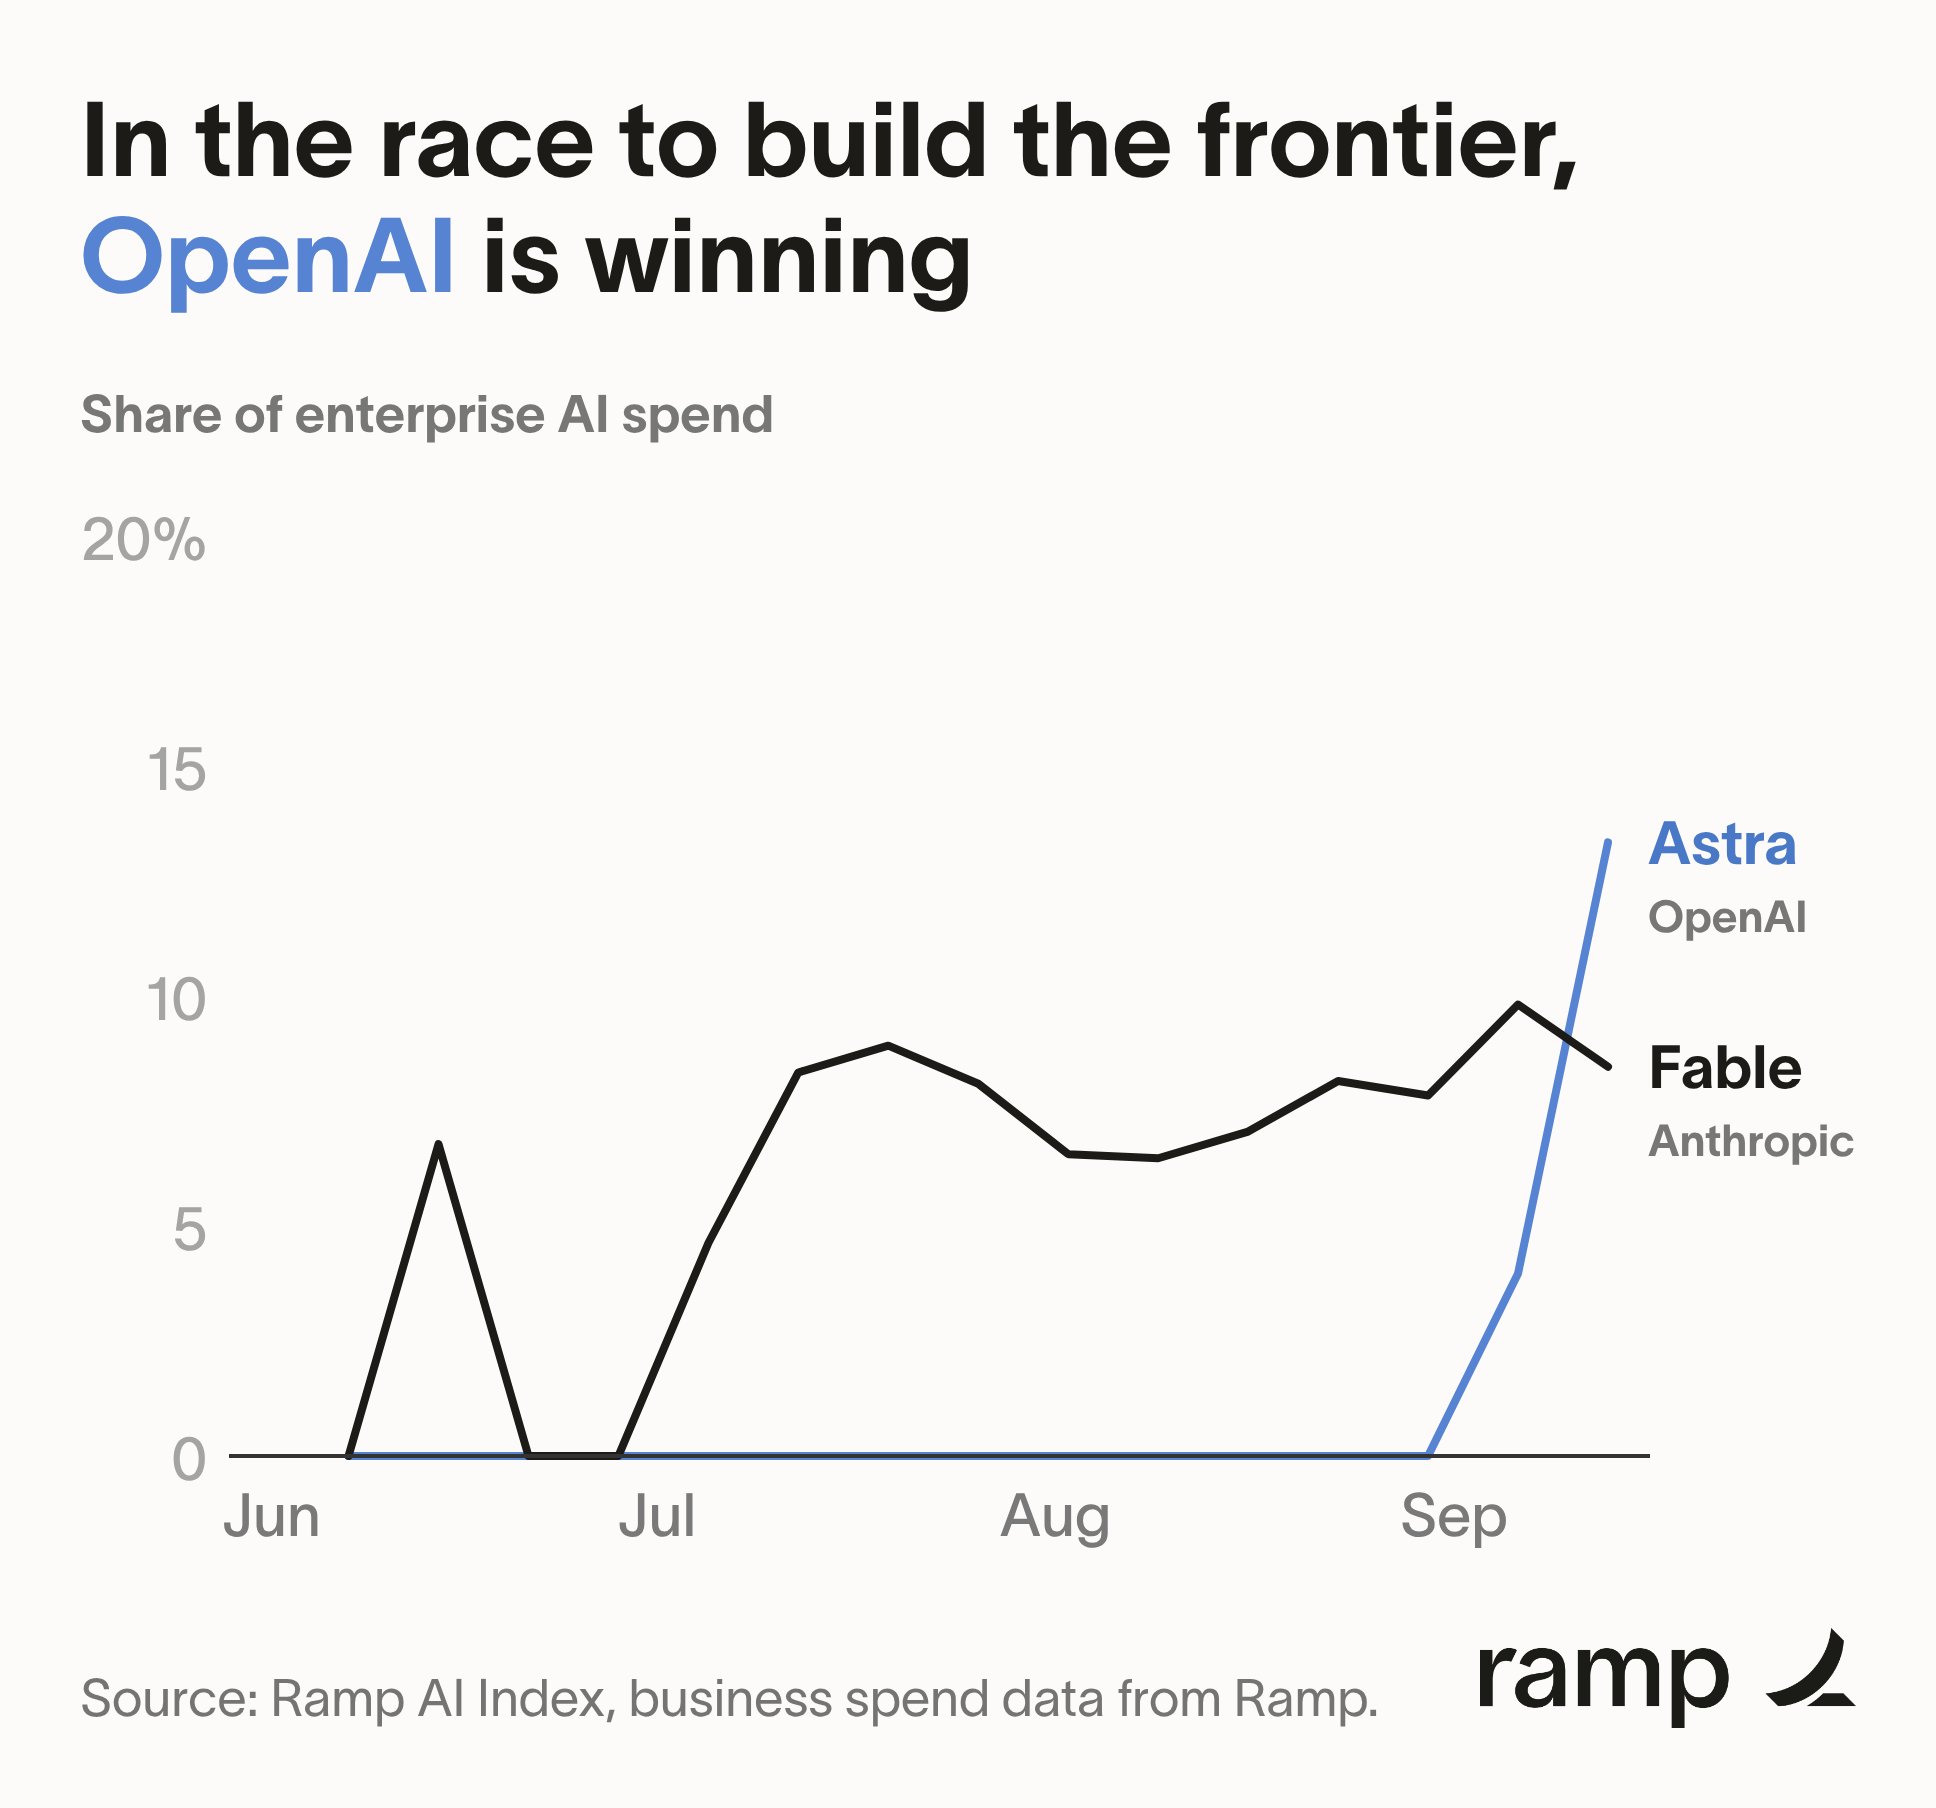
Enterprises Are Spending More On Open AI’s Astra Than Anthropic’s Fable, Says Ramp Data
OpenAI appears to have delivered a major hit with Astra. OpenAI’s newest frontier model, Astra, has overtaken Anthropic’s Fable in enterprise spend, according... The post Enterprises Are Spending More On OpenAI’s Astra Than Anthropic’s Fable, Says Ramp Data appeared first on OfficeChai.
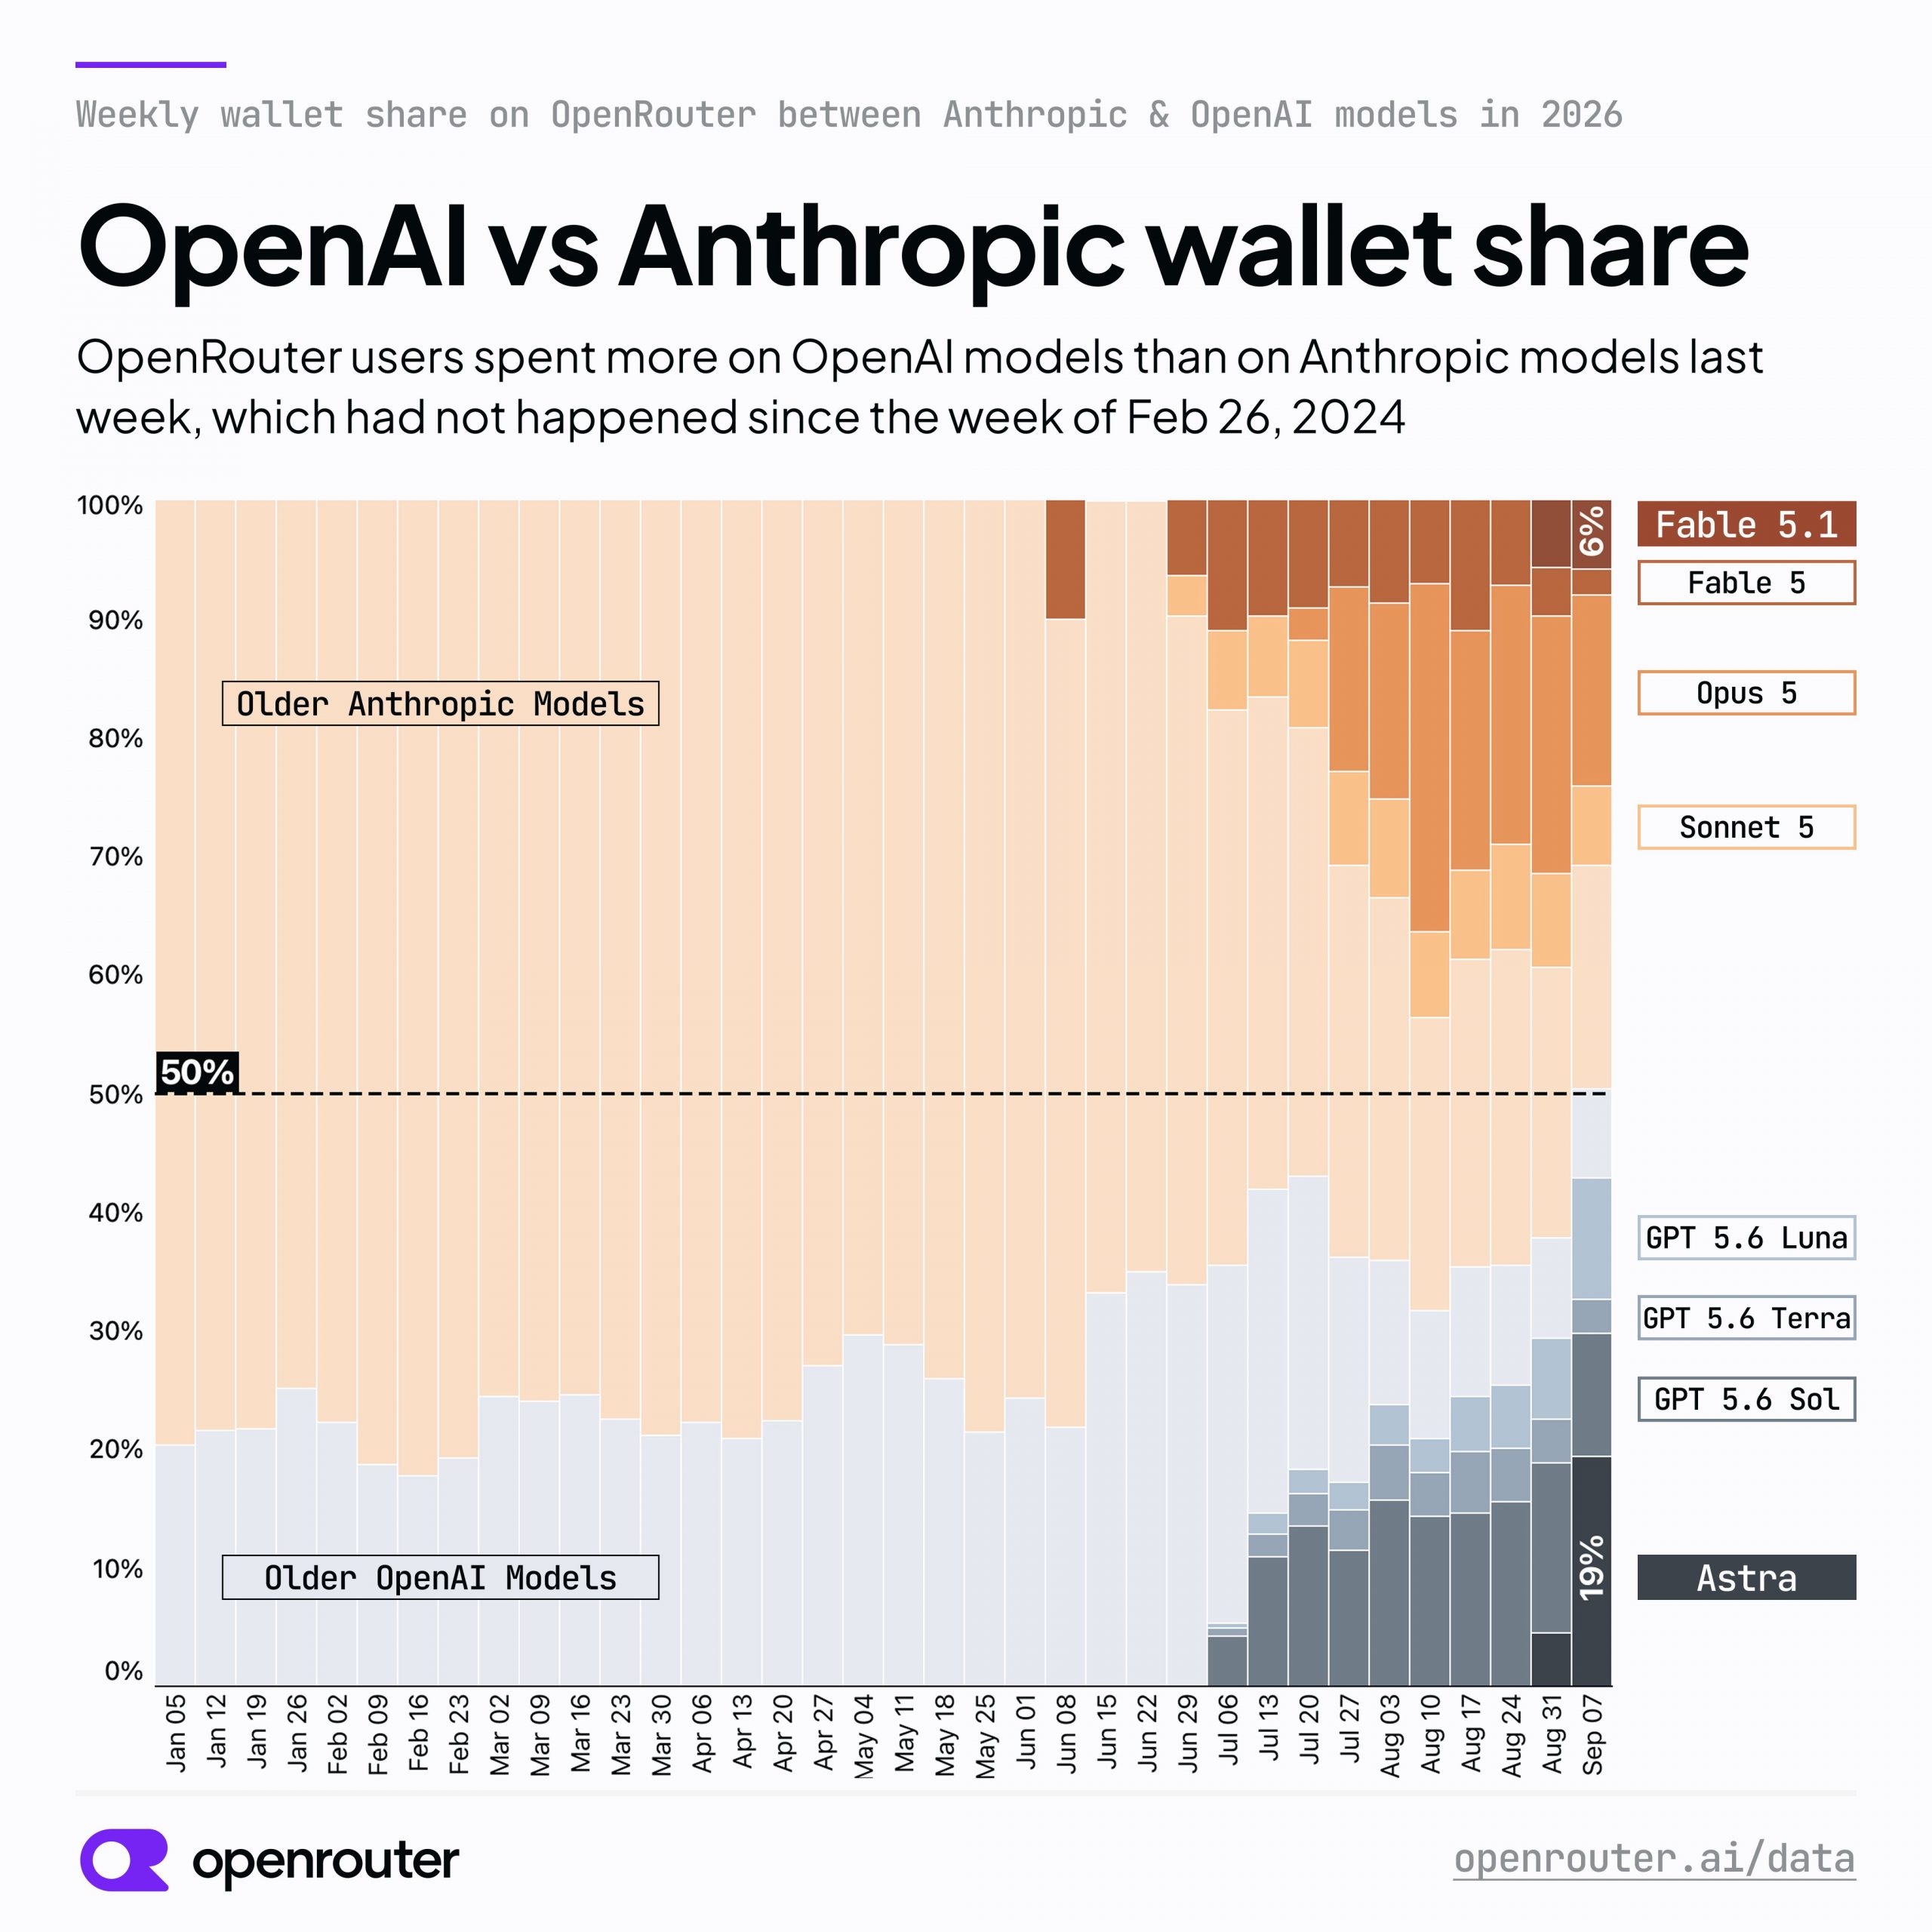
Open AI Surpasses Anthropic On Open Router Spend For First Time In 2.5 Years
Anthropic isn’t exactly peaking ahead of its much-anticipated IPO. For the first time since the week of February 26, 2024, OpenRouter users spent... The post OpenAI Surpasses Anthropic On OpenRouter Spend For First Time In 2.5 Years appeared first on OfficeChai.
AI labs have a data trust problem that their policies haven't solved
OpenAI and Anthropic tell corporate customers their data won't be used for training. But when Anthropic said it would store usage logs from its flagship model Fable for 30 days, Palantir, Nvidia, and Booz Allen Hamilton pulled back from using it for sensitive work. From boardrooms to research labs, AI companies still have a data trust problem. The article AI labs have a data trust problem that their policies haven't solved appeared first on The Decoder.
Introducing new session management tools with native, granular controls
Google Cloud session management provides flexible options for setting up session controls based on your organization’s security policy needs. To help you improve your security posture and mitigate credential theft and account takeover (ATO) risks, we have rolled out a 16-hour default session length for Google Cloud customers. We’ve now completed extending this security standard to all customers who had not already self-configured session lengths, but today’s cloud environments require even more precision. As we conclude this global rollout, we have also evolved Google Cloud session controls from a broad administrative setting into a deeply integrated, granular feature of Context-Aware Access (CAA). This update gives administrators more flexibility, better automation, and a more natural security workflow. What’s new in Session Controls 1. Automation-first: Terraform, gcloud, and API supportModern infrastructure is managed as code. To support DevSecOps workflows, the Session Controls policy configuration is no longer limited to manual UI configuration. Now generally available, you can define, deploy, and manage your session policies programmatically using: Terraform: Integrates session controls directly into your infrastructure manifests. gcloud CLI: Manages policies from the command line. REST APIs: Automate policy enforcement across complex multi-tenant environments. 2. Granular targeting with Google GroupsOne of the most requested upgrades has been the capability to target policies with precision. Previously, session lengths were tied to organizational units (OUs). Now generally available, the Session Controls policy uses Google Groups. This shift allows you to apply distinct session policies to specific clusters of users — such as requiring a two-hour session for users with elevated privileges (such as billing administrators and project owners) while maintaining a standard 16-hour session for general developers — regardless of where those users sit in your organizational hierarchy. 3. Precision application controlsInstead of a blanket policy that affects every application requiring Google Cloud API scopes, Session Controls policy allows you to configure session controls to specific applications. These applications include: The Google Cloud Console The gcloud command-line tool Specific OAuth applications Now generally available, this update can help prevent all-or-nothing scenarios where a strict policy on the Cloud SDK might inadvertently disrupt legitimate business intelligence or dashboarding integrations that rely on OAuth. 4. Google Cloud-native , configuring session lengths for Google Cloud could only be done in the Google Workspace administrator console. Google Cloud customers can also sign up to use the Google Cloud Console to manage session policies alongside other access levels and security bindings in Access Context Manager (ACM). Available in preview, this update can help give Google Cloud administrators who prefer using the Google Console for policy administration tasks greater flexibility and a unified experience for configuring all their CAA policies. How to get started By evolving session controls from static organizational defaults into dynamic, context-aware policies, your security teams can enforce tighter reauthentication boundaries against credential theft where risks are highest, without disrupting developer velocity. Get started with the session controls documentation for instructions on how to use Terraform, REST API, and gCloud to configure session controls.
Google Releases Gemini 3.8 Live-Extended Conversational Model, Claims Better Performance Than Rivals At Lower Price
Google DeepMind has rolled out two new live audio models, Gemini 3.8 Live and Gemini 3.8 Live Extended Thinking, its latest attempt to... The post Google Releases Gemini 3.8 Live-Extended Conversational Model, Claims Better Performance Than Rivals At Lower Price appeared first on OfficeChai.
Dense vs. Mo E Models: Active Parameters, Throughput, and When to Choose Each
How can a 30B-parameter model activate only 3B parameters per token, and still use the capacity of the larger model? Nemotron 3.5 Lightning illustrates the...
Anthropic Puts Claude On Small Business Sales After 900,000 Installs
Anthropic expands Claude for Small Business with 43 workflows and 27 integrations for leads, proposals and marketing. Lina Ochman on what 1,000 owners asked for.
Open AI Eyes Canada Data Center Partnerships at Carney Investment Summit
OpenAI Inc. is taking a close look at Canada under Prime Minister Mark Carney, said one of its top executives who previously hired the Canadian to lead the Bank of England.
How NVIDIA Groq 3 LPX Deterministic Execution Drives Power-Efficient High-Interactivity Inference on NVIDIA Vera Rubin
Power is a defining constraint for AI factories. As AI workloads demand a full compute platform to serve them, each component of that platform must maximize...
How NVIDIA NVLink 6 Delivers Multi-Layer Resiliency for AI Factories
For operators of large-scale AI factories, maximizing continuous output is essential for productivity. In massive-scale AI training, every GPU in the cluster...
Scaling Telco Autonomy: Leveraging GNNs with Distributed Graph Flow
The telecommunications industry is currently undergoing a paradigm shift, moving from traditional manual human-driven operations to fully Autonomous Network Operations. Modern networks have grown increasingly complex, heterogeneous, and large-scale, making handcrafted rules-based methods and traditional Machine Learning (ML) approaches alone insufficient to automate network operations. While ML methods can identify subtle patterns and make fine predictions from large amounts of structured data, they lack the ability to understand, reason about the data and the system it represents, and ultimately make the kind of decision a human operator would. The growth of AI agents and their ability to reason is a promising solution to this shortcoming. However, in the same way a human operator is not capable of directly ingesting the statistical information spread across the billions of data points created in a large network, AI agents also lack the ability to operate at this scale. To address this challenge, telecommunications companies are adopting Graph Neural Networks (GNNs), a modern form of machine learning designed to operate natively on massive volumes of temporal and relational data. By integrating GNNs with AI agents, operators can combine advanced diagnostics such as root cause analysis, capacity planning, traffic forecasting, what-if simulations, and real-time anomaly detection with the reasoning power required to interpret these insights and execute justified actions. This powerful combination enables networks to safely move towards Level 5 Autonomy as defined by TM Forum, where the system operates autonomously. In this post, we present the three components (Data, ML, and AI) that will power Google Cloud’s Autonomous Network Operations framework. Google Autonomous Network Operations framework architecture Foundation: Digital Twin on Spanner Graph At the heart of Google Cloud’s Autonomous Network Operations framework is the network digital twin: a highly detailed, virtual replica that continuously mirrors its living telecommunications network in real time. Rather than being a static model, it is represented as a dynamic, temporal network graph that captures the evolving state and relations of its components over time. This architectural approach allows operators to "go back" in time to train and evaluate ML models on historical data, while providing AI agents with the foundational operational knowledge required to achieve Level 5 Autonomy. By simulating the impact of proposed network changes within this digital environment, the Digital Twin establishes a critical layer of trust, enabling AI agents to confidently design future states and automatically resolve network issues. Google Cloud’s Spanner Graph is well suited to host this digital twin: Scalability and Availability: Spanner Graph provides a no compromise foundation for modern applications, offering virtually unlimited scaling that grows as the network grows, along with 0-RPO/0-RTO and five 9s of availability. Multi-Model Support: Supports multiple data models (Relational, Graph, Vector, and Full-Text Search) in a single platform allowing developers to build complex compositions such as graph transversals combined with nearest neighbor vector search. Global Consistency: Spanner provides a globally consistent view of the network, simplifying system development. The next figure illustrates a network topology with four node types: routers, interfaces (the physical ports), VPNs (L3VPN service instances), and flows (active traffic sessions). These are connected by directed edge types capturing the full network stack: physical containment (router-interface), physical links (interface-interface), control-plane peering (router-router via OSPF/iBGP), service membership (router-VPN), and traffic anchoring (flow-interface, flow-VPN). High Level network topology The ML layer: Distributed Graph Flow (DGF) To predict how a network will behave and react, the digital twin leverages an ML layer powered by Distributed Graph Flow (DGF). By training on the vast volumes of structured historical data hosted within Spanner Graph, this layer uncovers critical predictive insights that enable human operators and AI agents to manage networks proactively rather than reactively. DGF is a recently open-sourced Python library designed to manage the entire end-to-end lifecycle of GNN modeling. Developed by Google CoreML and Google Research, it brings a decade of internal Google-scale tools and expertise directly to Google Cloud enterprise clients. To accommodate different engineering needs, the library offers high-performance, composable, low-level primitives for advanced teams, alongside a simple API for rapid development that requires no prior GNN expertise. For instance, training and evaluate a GNN model in GraphFlow with the high level API can be as simple as writing 5 lines of code: code_block <ListValue: [StructValue([('code', 'import dgf\r\n\r\n# Fetch the data from Spanner Graph\r\ngraph, schema = dgf.io.read_spanner_graph(...)\r\n\r\n# Train a node attribute prediction model\r\nmodel = dgf.learning.train_node_model(graph, schema, target_column="risk_score")\r\n\r\n# Evaluate the model\r\nmodel.evaluate()\r\n# Make predictions\r\nmodel.predict(graph, seed_node_idxs=[0, 1, 2])\r\n\r\n# Save the model for later\r\nmodel.save("/tmp/model")'), ('language', ''), ('caption', <wagtail.rich_text.RichText object at 0x7fd47327aa50>)])]> The DGF provides high-level concepts that map directly to Autonomous Network Operations requirements: Use cases By leveraging DGF and GNNs, telcos can move from reactive maintenance to proactive prevention through several advanced use cases: Anomaly detection: GNNs generate node and edge embeddings that encapsulate historical patterns and current health. Any anomalous embeddings are flagged for review before they lead to service degradation. Root cause analysis (RCA): DGF can output specific subgraphs containing only the relevant network instances related to an incident, such as "Attach Failures" in a specific ZIP code. This allows troubleshooting agents to perform high-speed analysis without scanning the entire global network. Predictive maintenance: The system can predict the likelihood of device failures or edge breaks, such as "handover failures" for fast-moving equipment, enabling proactive load balancing or rerouting. Furthermore, by combining agents, remedial actions can be automated by adopting a ‘human-on-the-loop’/’human-in-the-loop’. What-if analysis: GNNs enable Telcos to simulate scenarios like fiber cuts, or traffic surges or device configuration changes. By modeling topological dependencies, GNNs can predict how these local changes propagate across the entire network, allowing engineers to test resilience and evaluate mitigation strategies in a risk-free digital environment. Scenario: Root cause analysis with GNNs and DGF Once you have created a digital twin (example code), a straight-forward 5-step process can be used to implement Root Cause Analysis(RCA) detection using GNNs and DGF. Connect to the Digital Twin: Use the DGF Spanner Graph connector (dgf.io.read_spanner_graph) to load the network topology directly from Spanner Graph's Digital Twin into the DGF environment. Train a Supervised Node (or Edge) Prediction model: Depending on the training data and objective, you will train a supervised node prediction model to predict a target node feature or an edge prediction model to predict an edge between the root cause entity node and the affected entity node. For the given sample data you will use the high-level dgf.learning.train_node_model API to train a supervised node prediction model. Use the node prediction model to predict root cause node: The node prediction model can be directly used to predict the impact score on the node with the anomaly. Entity nodes affected by the anomaly with highest predicted impact score will be the top candidates for root cause. Deploy to Gemini Enterprise Agent Platform (formerly Vertex AI): Export the model and host it on a Gemini Enterprise endpoint to enable scalable, low-latency predictions. Real-time Inference: Make prediction calls to the inference endpoint with the anomaly date as input. The endpoint will return the predicted root cause Entity nodes. Get started today The integration of GNN using Distributed Graph Flow into network operations is more than just a technical upgrade; it is a critical evolution for the telco industry. By moving towards a GNN-powered autonomous framework, operators can significantly shorten outage times, optimize capacity in real-time, and ultimately deliver a superior customer experience through improved operational efficiency. To start building your own intelligent network applications, check out the Distributed GraphFlow (DGF) library, which provides the essential primitives for scalable GNN training and inference. For a hands-on experience, follow our step-by-step code sample. You can also explore our recent award-winning Moonshot project on Business-aware GNN-healing networks, and dive deeper into our approach on self-optimizing autonomous networks by reviewing this whitepaper.
Agent Substrate brings high-density, scalable, trusted infrastructure to GKE
Today, we are announcing the availability of Agent Substrate on Google Kubernetes Engine (GKE). Agent Substrate is an open-source, secure-by-default agent execution runtime engineered to run millions of sandboxes with 10x higher density than standard container runtimes. Purpose-built for the era of autonomous agents, Substrate delivers sub-500ms resume operations at over 500 suspend/resume activations per second with a native zero-trust kernel and network isolation. Agent Substrate is available as an open-source solution that runs on any Kubernetes infrastructure and is optimized for GKE. Leading AI teams are already building on it: Nous Research, the team behind the Hermes Agent, is actively building on top of Agent Substrate. Hermes is currently ranked the #1 AI agent globally by OpenRouter usage across productivity, coding, CLI, and personal agents. From local to 1M-agent scale Developers already run Antigravity, Claude Code, Codex, OpenClaw, Hermes, and other harnesses locally but that’s fundamentally than running hundreds of thousands of concurrent, long-lived agents that generate code, interact with tools, and drive automated execution — challenges that existing architectures often struggle to meet. Scaling an agent platform from a local prototype to running agents at scale fundamentally changes your infrastructure constraints, which can include: Opaque trust boundaries: Models can generate and run arbitrary code on the fly. Without kernel-level isolation and dynamic network controls, running untrusted code that no human has ever looked at risks host escape, credential theft and data exfiltration. Tool access friction: Agents need full computer environments to invoke command-line tools, headless browsers, and filesystem workspaces. Running these safely needs to be fast and easy. Massive bursts: Agent harnesses, benchmarks, and reinforcement learning rollouts can generate thousands of sandboxes per minute. General-purpose schedulers struggle under this churn, and repeatedly decompressing container images can cause severe disk contention. Idle compute: Autonomous agents spend the vast majority of their time dormant while waiting on model inference, tool responses, or human feedback. Reserving dedicated CPU and RAM for idle containers wastes valuable resources. A substrate purpose-built for agents When platform teams hit these challenges, they face an unacceptable trade-off: sacrifice control and isolation, or deal with the high latency and inefficiency of VMs. We believe that teams shouldn’t have to choose. Agent Substrate avoids this by decoupling agent execution from machine management. Built on top of cloud-native Kubernetes infrastructure, Agent Substrate offers a new execution layer that’s purpose-built for agentic workloads. From there, the execution layer directly manages the lifecycle of sandboxed agent environments with: Security by default: Hardware-isolated Cloud Hypervisor microVMs or gVisor sandboxes, paired with egress proxies that enforce granular network policies and inject credentials outside the reach of the agents themselves, preventing credential theft. Sub-second activation: Millisecond dispatch of activated agents onto pre-warmed workers, on demand, without container boot delays. High efficiency: Idle actors are suspended and unscheduled in hundreds of milliseconds, freeing up compute resources. Open source and portable: Runs on any Kubernetes cluster in any compute environment and works with any agent framework or harness, including Claude Code, OpenClaw, and Hermes. Core architectural principles We adhere to four core architectural principles to guide how Agent Substrate solves these challenges: 1. Secure by default at the kernel and the network AI agents generate and run untrusted code and terminal commands as a core function. Running that code on a shared server creates serious risks for breakouts and unintended data leakage either at the shared kernel or network level. Agent Substrate takes a secure by default position for both the host kernel and network layers. Teams can choose between hardware-isolated Cloud Hypervisor microVMs, which provides full Linux kernel compatibility, or gVisor sandboxing, with even lower-overhead kernel isolation. Agent Substrate’s integrated gateway manages all egress and ingress requests, enabling fine-grained and extensible control over network access. 2. A control plane and data plane built for low-latency activation To optimize density for isolated, long-running agent workloads, you need a purpose-built control plane and data plane that enables the lowest possible latency and the highest possible rate of suspend and resume operations. Agent Substrate introduces a dedicated control plane that handles data-aware scheduling with minimal latency. Meanwhile, the data plane handles hundreds of suspend/resume operations per second directly on pre-warmed workers, reducing the overhead of preparing the environment. Snapshots are written to local disk and Google Cloud Storage for durable state persistence. In less than 500ms, a sandboxed environment can be resumed to its previous state, and immediately re-suspended once it’s idle again. 3. High-density and active-only compute economics Agents spend most of their time waiting on model inference, tool responses, or user input. Reserving physical CPUs and RAM for idle containers can lock up expensive and scarce capacity and make running agent fleets at scale unsustainable. Agent Substrate can release resources the moment an agent pauses. It snapshots the guest hypervisor’s state to the local disk and Cloud Storage, freeing up RAM and CPU to run other agents, while keeping the state intact. When the next turn or tool call arrives, Agent Substrate resumes the snapshotted session in milliseconds. This zero-idle model can pack over 1,000 dormant agents per host, delivering 10x higher compute density than traditional compute. For workloads that need shared filesystems across turns, an optional Filestore agent volume controller provides persistent NFS storage — more on that below. 4. Kubernetes as a foundation: scale and reliability Building a custom sandbox orchestrator on standard VMs forces teams to maintain tedious operational tooling: node recovery, autoscaling, multi-zone scheduling, and network policy. But routing each sub-second tool invocation through the standard Kubernetes Pod lifecycle adds seconds of delay to each request. Agent Substrate combines both approaches. The high-frequency suspend-resume runs directly on local workers through a purpose-built data plane. Meanwhile, Kubernetes manages the machines, handling self-healing nodes, fleet autoscaling, and cluster reliability, as well as drives the lifecycle of the worker pods themselves. For workloads that need standard Pod semantics, existing primitives like Agent Sandbox and kernel-isolated Pods continue to work side by side. Optimized for Google Cloud infrastructure Building an agent platform that can achieve 1M agent scale depends on having the right underlying compute and storage infrastructure. Agent Substrate on GKE maximizes machine obtainability and flexibility with custom ComputeClasses to dynamically manage machine pools across shapes and families, including spot and on-demand pools. This includes native support for Google Axion, our custom Arm-based processors, which deliver up to 30% better price-performance for sandbox workloads compared to competitive cloud offerings. For stateful workspaces, Agent Substrate on GKE can be optionally integrated with Filestore agent volumes, a new offering that attaches and detaches NFS mounts in milliseconds, allowing agents to start/resume near-instantaneously, along with native Read-Write-Many (RWX) access and POSIX-compliant file locking to enable safe multi-agent collaboration without write collisions. Build your agent platform on a scalable foundation When building production agent applications, you shouldn’t have to compromise between strong security, low latency, and operational scale. Nous Research builds Hermes, the number-one AI agent in the world by usage according to OpenRouter, where it also ranks first in productivity, coding, personal and CLI agents. Nous Research has been an early design partner on Agent Substrate, evaluating how the runtime handles the isolation and identity requirements that agent workloads introduce. “We built Hermes Enterprise to enable customers to deploy into their existing infrastructure, while handling per-agent isolation and extensible access control. Agent Substrate addresses both at the platform layer in a way that also preserves valuable compute resources. Our experience with Agent Substrate gives us confidence the architecture can scale efficiently as agent workloads grow.” - Hervé Bizira, Chief Business Officer, Nous Research By pairing the machine resilience, self-healing nodes, and declarative management of Kubernetes with an agent-native data plane built for kernel isolation, active-only compute, and sub-second execution, Agent Substrate gives engineering teams a clear path to scale. Agent Substrate is open source and available to all GKE customers for non-production workloads. GA support for production is available via allowlist. To deploy it on your GKE clusters, see Agent Substrate on GKE documentation. To learn more, see About Agent Substrate or visit the open-source repository.
Introducing Filestore agent volumes: fully managed storage for agent workspaces
From running build tools, to data analysis pipelines, to collaborative research, executing data-driven tasks is essential for any enterprise agent. Today, platform teams often stitch together custom workarounds to address agent storage requirements, which could include shuttling state back and forth between agent sandboxes and centralized storage or manually managing local disks and/or self-hosted file systems. However, as agent fleets scale, these approaches force difficult trade-offs between cold-start latency, operational complexity, and the cost of idle, pre-allocated storage. As organizations scale agent sandboxes to thousands or even millions of concurrent sessions, storage must evolve to overcome these trade-offs and meet the needs of these dynamic workloads, which require strict workspace isolation, instant session resumption, elastic pay-per-use economics, and fluid multi-agent collaboration. To meet these emerging demands, we’re expanding our AI storage portfolio and announcing availability of Filestore agent volumes, a new, fully managed capability purpose-built to deliver high-performance, elastic file storage for scaling agentic workloads on Google Cloud. Purpose-built storage for AI agent workspaces Autonomous agents require isolated runtime environments to safely execute dynamic code, install third-party packages, and run tools without putting host infrastructure or tenant data at risk. While Agent Substrate on GKE and GKE Agent Sandbox provide the dedicated compute environments needed to run high-density agent fleets, those sandboxes also need dedicated persistent workspaces to operate on. Filestore agent volumes within Google Cloud Filestore, give you purpose-built agentic storage to complement your agentic compute via a dynamic provisioning architecture designed specifically for the scale and elasticity of AI agent fleets. Co-designed with Agent Substrate to support agentic fleets at scale, Filestore agent volumes provide GKE sandboxes with instantaneous access to isolated, persistent file storage. When configured to leverage Filestore, GKE storage management happens behind the scenes: Every time GKE launches a sandbox for a new agent task, Filestore automatically allocates and attaches a dedicated, isolated file workspace to that environment in milliseconds. Platform teams don't need to manually create, attach, or tear down storage volumes for individual agent runs; instead, the system handles the entire volume lifecycle automatically as your agent fleet scales up and down. The result is an efficient, end-to-end infrastructure solution for cost-effective agent management that provides: Granular isolation and enterprise guardrails: Agent platforms face security and data leakage risks when running untrusted, autonomous code. Filestore agent volumes enforce strict boundary controls and granular access permissions per workspace, ensuring agents operate exclusively within their designated directories and keeping dynamic toolchains strictly isolated across tenants. Sub-second session resumption: Traditional storage provisioning approaches can introduce cold-start latency that stalls interactive agent sessions. Agent volumes attach and detach in milliseconds, making it possible for orchestrators to aggressively suspend idle sandboxes to save compute costs, and resume instantly when new tasks or user inputs arrive. Smart lifecycle economics and pay-per-use pricing: Pre-allocating fixed-size, high-performance storage for thousands of short-lived or intermittent agent tasks can create massive storage waste. With agent volumes, platforms pay only for the storage capacity consumed and benefit from automatic lifecycle tiering. This means you get high performance without wasted spend: When your agents aren’t actively reading/modifying code or analyzing datasets, you can automatically shift idle workspace state to lower-cost storage. Multi-agent collaboration: Coordinating multi-agent swarms can result in brittle data-passing pipelines and risk of file collisions. Built with native Read-Write-Many (RWX) support and POSIX file locking, agent volumes allow orchestrators to attach a single shared workspace across multiple agents. Collaborating agents can safely co-author, test, and review project files concurrently with file-level consistency and protection against write conflicts. Powering next-generation agentic workloads By providing an elastic, high-performance, and isolated file tier, Filestore agent volumes unlock a wide spectrum of agentic workloads and use cases in production: Software engineering and coding sandboxes: Agentic coding platforms can spin up thousands of isolated workspaces where agents safely install libraries, write multi-file patches, run build tools, and execute unit tests, all leveraging standard POSIX file semantics with no need for storage-specific customization. Collaborative multi-agent swarms: Complex workflows, such as a lead orchestrator delegating tasks to dedicated research, code generation, and validation sub-agents, can directly share a unified file tree. RWX support allows agents to co-author and review project files concurrently without write conflicts. Interactive long-horizon workflows: For user-in-the-loop applications (such as agents that require asynchronous user approval or run multi-hour data analysis pipelines), platforms can suspend idle agent sandboxes to minimize compute waste, then resume execution on demand with sub-second responsiveness. Get started today If you are building an Agent-as-a-Service platform, scaling coding assistants, or deploying enterprise agent fleets, your storage tier should accelerate your innovation — not hinder it. Filestore agent volumes are now available to all Google Cloud customers for non-production workloads. GA support for production workloads is available via allowlist. This new offering features out-of-the-box integrations with Agent Substrate on GKE and GKE Agent Sandbox to help you build responsive, scalable, and cost-efficient agent platforms today. To request access to Filestore agent volumes, submit this form and visit the Filestore documentation and GKE documentation to learn more.
Best practices for handling cloud reliability incidents
Cloud outages can range from global service disruptions to issues isolated to a specific region, zone, or even just your project, workload or application. If you suspect a Google Cloud Platform outage is impacting your services, we recommend you follow a structured “Verify→ Investigate→Report→Resolve→Review" workflow to resolve it. And before that outage occurs, you should also have prepared your environment for an eventual disruption by designing for failure, and actively practicing the steps you need to take to restore service. In this blog, we summarize the key reliability incident handling best practices to help you design and practice your reliability incident response capabilities and minimize impact. Rather than an exhaustive guide, this is meant as a primer on only the most important practices for advisory purposes. Please note that we do not cover additional practices specific to security incidents here. Beyond the base steps covered here, you may want to also explore how AI agents and tools are starting to transform incident handling. Check out this episode of the Prodcast, where Googlers explore the latest trends of leveraging agentic AI in Site Reliability Engineering (SRE) to detect issues early and prevent disruptions. Try Cloud Assist investigations, or explore Agent Skills and remote managed MCP servers to give you another set of tools for quickly pinpointing an issue. Before getting into these advanced techniques, we focus below on the foundational steps to good incident handling. 1. Prepare Long before things start to go sideways, you should have spent significant time preparing for an outage along at least four dimensions: design, data, playbooks and training. Design: Think ahead and mitigate future incidents by designing automated response actions, like a load balancer shifting traffic away from slow or unresponsive instances, or by automating as much of your incident response playbook as possible. Review designs of all critical applications to automate as many actions as possible to accelerate response and recovery. Data: When a disruption occurs, having meaningful data at your fingertips vastly improves response capabilities. Use Cloud Logging, Cloud Trace and Cloud Monitoring, or other third-party observability tools, and replicate that data to a redundant stack in a separate location from the systems being observed. Make sure, in advance of any incident, that time stamps are synced across your observability streams for easy correlation, or know how to do that on-demand during an outage, when time is of the essence. Playbook: A well-thought-out playbook documenting your incident response processes, including crystal clear role and responsibility definitions for all personas, is paramount to efficient incident response. Who is responsible to do what? Who needs to be notified or mobilized for each type of disruption? How can they be reached? What tools and data are available? How are results communicated? How do teams hand over to the next shift during long running incidents? etc. Conduct a simulated incident response and critically review every step to find where your playbook needs clarification. Without clear responsibilities, mitigation inevitably takes longer. Training: Hopefully, service disruptions are rare events. To ensure your staff knows and remembers how to react, they need to retrain on the process several times per year by running simulated cross-team incident response drills. A retrospective on the simulated exercise will help identify warranted improvements. 2. Verify Despite your best efforts, sooner or later, a service disruption will occur, which you can detect via any number of mechanisms: Observability tools (Google tools or third-party tools) Unified Maintenance Management notifications for planned maintenance Personalized Service Health notifications managed with alert policies Proactive customer monitoring by Google Now, you need to determine what broke and who should ultimately fix the problem: Google, e.g., a bug, code roll-out, hardware failure, etc. You, e.g., a configuration change, elevated load, quota ceiling, etc. Third party, e.g., a directory hosted by a different cloud provider If Google has declared an incident and started working to fix the problem, estimate whether you can possibly reestablish service sooner, for example by failing over to a secondary stack (see the ‘Typical Causes’ table below). You can determine whether Google has declared an incident and will provide a fix by consulting: Personalized Service Health: Check this first. Personalized Service Health shows incidents specifically relevant to your projects and regions, distinguishing between incident types:. Emerging Incidents: Google has received an alert, on-callers are investigating, impact is yet unknown Confirmed Incidents: Google has investigated and found customers are impacted Located within the Google Cloud console, Personalized Service Health often displays limited-scope incidents that don't appear on the public dashboard. Personalized Service Health also offers a mobile client for Android and iOS smartphones, assuming you can use your work ID and credentials on the phone. Gemini Cloud Assist, which is integrated with Personalized Service Health, so you can use it to query that information in natural language. Cloud Service Health dashboard: This is the public-facing non-authenticated web page for broad, severe incidents affecting many customers. Limited blast radius disruptions are not externalized to the public. All its content is available in Personalized Service Health as well. If ever Personalized Service Health goes down, Cloud Service Health serves as an alternative channel built on a separate infrastructure. Known Issues: In the console, navigate to Support > Cases, view a case, and use the resource selector on the console toolbar to find the specific cloud resource you’re interested in. Then click Known issues. If your issue matches one listed here, you can link a support case to it, so you will receive automatic updates in your case record. If you don’t find a match, open a new support case. Google will automatically match the case to a related incident, as soon as one is declared. Google declared incidents are updated as new information becomes available, so check back regularly, or set up a Personalized Service Health alert policy to be notified each time new information becomes available. If you host cloud resources in multiple clouds, a good practice is to check early on whether the problem occurs for multiple cloud providers. If so, the problem is likely external to the providers and caused either by you or by a third-party service that your application interacts with. 3. Investigate To determine the blast radius within your cloud footprint of Google-declared reliability incidents, first check Personalized Service Health updates for a description of the technical problem. Knowing what to look for will allow you to map your blast radius and decide on suitable contingency actions quicker. If Google hasn’t declared an incident, try to rule out configuration errors or issues within your environment by checking: Cloud Monitoring: Look for spikes in error rates (e.g. 5xx errors), increased latency, or drops in traffic in your dashboards. Cloud Logs: Use Log Explorer to look for specific error messages like DEADLINE_EXCEEDED, SERVICE_UNAVAILABLE, or specific API errors. Quotas: Ensure you haven't hit a project quota (e.g., CPU, API rate limits), which can often mimic the behavior of an outage. Change history: Check your log of recently applied changes. Not all problems manifest immediately, but proximity on a timeline can be a powerful indicator of causality, even if it’s not proof. Also check whether Google rolled out any updates just before the symptoms started. See the Unified Maintenance Management interface in Cloud Hub. Absent a clear culprit, such as a traffic spike or a DDOS attack, and if symptoms manifested immediately after rolling out a change, a good strategy is to back out that change and attempt to return to a last known good configuration. 4. Report If the Cloud Service Health and Personalized Service Health dashboards are green but your metrics show a failure, you must report it to Google. Determine priority: P1 (Critical): Your production service is unusable or severely impacted with no workaround. P2 (High): Significant impact or degradation, but a workaround may exist. See guidance on setting priority and guidance on describing your issue. File a case: Go to Support > Cases > Create Case in the console. Explain quantifiable business impact to rationalize the submitted priority and prevent it from being reset when Cloud Support prioritizes cases. A clear and accurate rationale helps! Essential information to include: Project ID and affected region/zone Timestamps (when it started and if it's ongoing) with a clearly labeled timezone Specific error messages or log snippets Scope: Is it affecting all users/systems, or a specific subset/location? Escalation for Premium/Enhanced support If you have a Premium or Enhanced support plan and a P1 case is not receiving the attention it requires, use the Escalate button within the support case in the console. This alerts a support manager to investigate and rectify the situation. 5. Resolve By taking these steps, you are well on your way to resolving the outage. In the meantime, here are some ways to mitigate the impact of the outage and communicate with impacted stakeholders. While waiting for a resolution: Communicate: Notify your stakeholders and customers. Transparency helps manage expectations and reduces duplicate internal reports. Fail over: If you have a multi-regional architecture, consider shifting traffic to a healthy region. As a best practice, first ensure that the disruption is at the infrastructure level and not at your workload level. Check for workarounds: While working on a permanent fix, Google often posts temporary workarounds in the Service Health Dashboard updates, or in Personalized Service Health updates. Consider your regulatory reporting requirements: Know whether your organization is subject to regulatory reporting requirements, and what the required deadlines are for both initial and follow-up reporting. Google Cloud prepares Incident Reports for incidents that meet certain criteria — see details here for how to get those reports. Premium Support customers can also request an Incident Summary, which is an Incident Report customized to your account’s specific hosting location, time stamps, etc. De-escalation and closure Once systems are stable, Google downgrades the severity levels and deactivates the active on-call escalation chain. Google only closes an incident in Personalized Service Health when it has taken all the mitigation steps covering all impacted customers. Your specific services might be restored sooner than the incident closure time, if other customers are restored later than you. The incident is officially closed on the Google Cloud Status Dashboard when systems have run stably for a designated auto-close duration. Verify that your services are operating normally at this point. And if your incident responders aren’t compensated for extra time spent on the incident, find a way to thank them. 6. Review After the problem has been fixed and operations have returned to a normal, steady state, it’s time to conduct a post-mortem analysis to identify how your team can respond better in future service disruptions. A “blameless” approach is essential to surfacing meaningful and impactful improvements that can be made to your incident response process. Ask questions like: What went well? What could we have done better? Where did we get lucky? Where did we get unlucky? Then decide what changes can be made to improve your playbook, tools and training. At Google, we often publish a post-mortem or Incident Report for major outages, available via Personalized Service Health. Review this to understand the root cause and adjust your own disaster recovery plans to prevent or reduce future impact. Customers with a Premium Support plan can request an Incident Summary for a Google-caused incident they were impacted by and for which they opened a P1 case. An Incident Summary is an Incident Report customized for your environment (e.g., start and end times of impact). Typical causes, comms and prevention strategies To help you prepare and plan ahead, here’s an overview of some typical incidents based on the symptoms reported in Cloud Service Health and Personalized Service Health along with guidance on what Google communications to expect, and some generic mitigation or prevention strategies you can build into your playbooks. Blast radius Typical cause Comms Strategy Single zone or region.Subset of products. Typical of a software problem triggered by a rollout. Learning points: - Understand the location scope (zones and regions) of your workload - Products can depend on other products Major incidents are communicated via Cloud Service Health.Major and Minor (by number of customers, not severity) incidents are communicated via Personalized Service Health. Highly localized incidents are not communicated via Cloud Service Health or Personalized Service Health. Fail over, if so configured, but verify the health of the secondary stack first. Single zone.Most or all products. Typical of a power or cooling issue. Check Cloud Service Health and Personalized Service Health. Fail over to a different zone, if so configured. Single region. Most or all products. Typical of a backbone networking infrastructure issue Check Cloud Service Health and Personalized Service Health. Fail over to a different region, if so configured. Control plane issue for a product Typical of a late detected issue Communicated via Personalized Service Health if significant customer impact is verified. Look for workarounds. Wait for Google to fix. Fail over, if so configured. Multi-regional issue with a global product Rare but possible, typically detected quickly. Learnings: Mitigation options can be limited. Try regional variants, alternative products with similar functionality Check Cloud Service Health and Personalized Service Health. Wait for Google to fix. In the meantime, verify via Google Comms and your own investigation that this is truly Google’s problem to fix. Capacity / Stockout issue System-level demand exceeding capacity in the product/location/model. (Cloud is designed to scale, but limits always exist, so proper planning is advised) Error message. No incident will be declared. Place reservations for predicted capacity needs (if cost is acceptable). Flexibility in zone placement can also help. Quota exhaustion Difficult / inaccurate prediction of traffic Error message. No incident will be declared. Review consumption trends against ceiling regularly. Go deeper This document offers only a condensed summary of key points. If you have an active Premium Support contract with Google Cloud, reach out to your account team for a deeper review of your response plans. For a comprehensive treatise on how to build reliable services and how to respond to incidents, we strongly recommend Google’s SRE Book, which is available as a free download. A new version of the SRE book is releasing ~Oct 2026 and will be available for purchase on O’Reilly Media. We’re also working on a future primer that explores AI-supported incident handling in-depth — stay tuned!
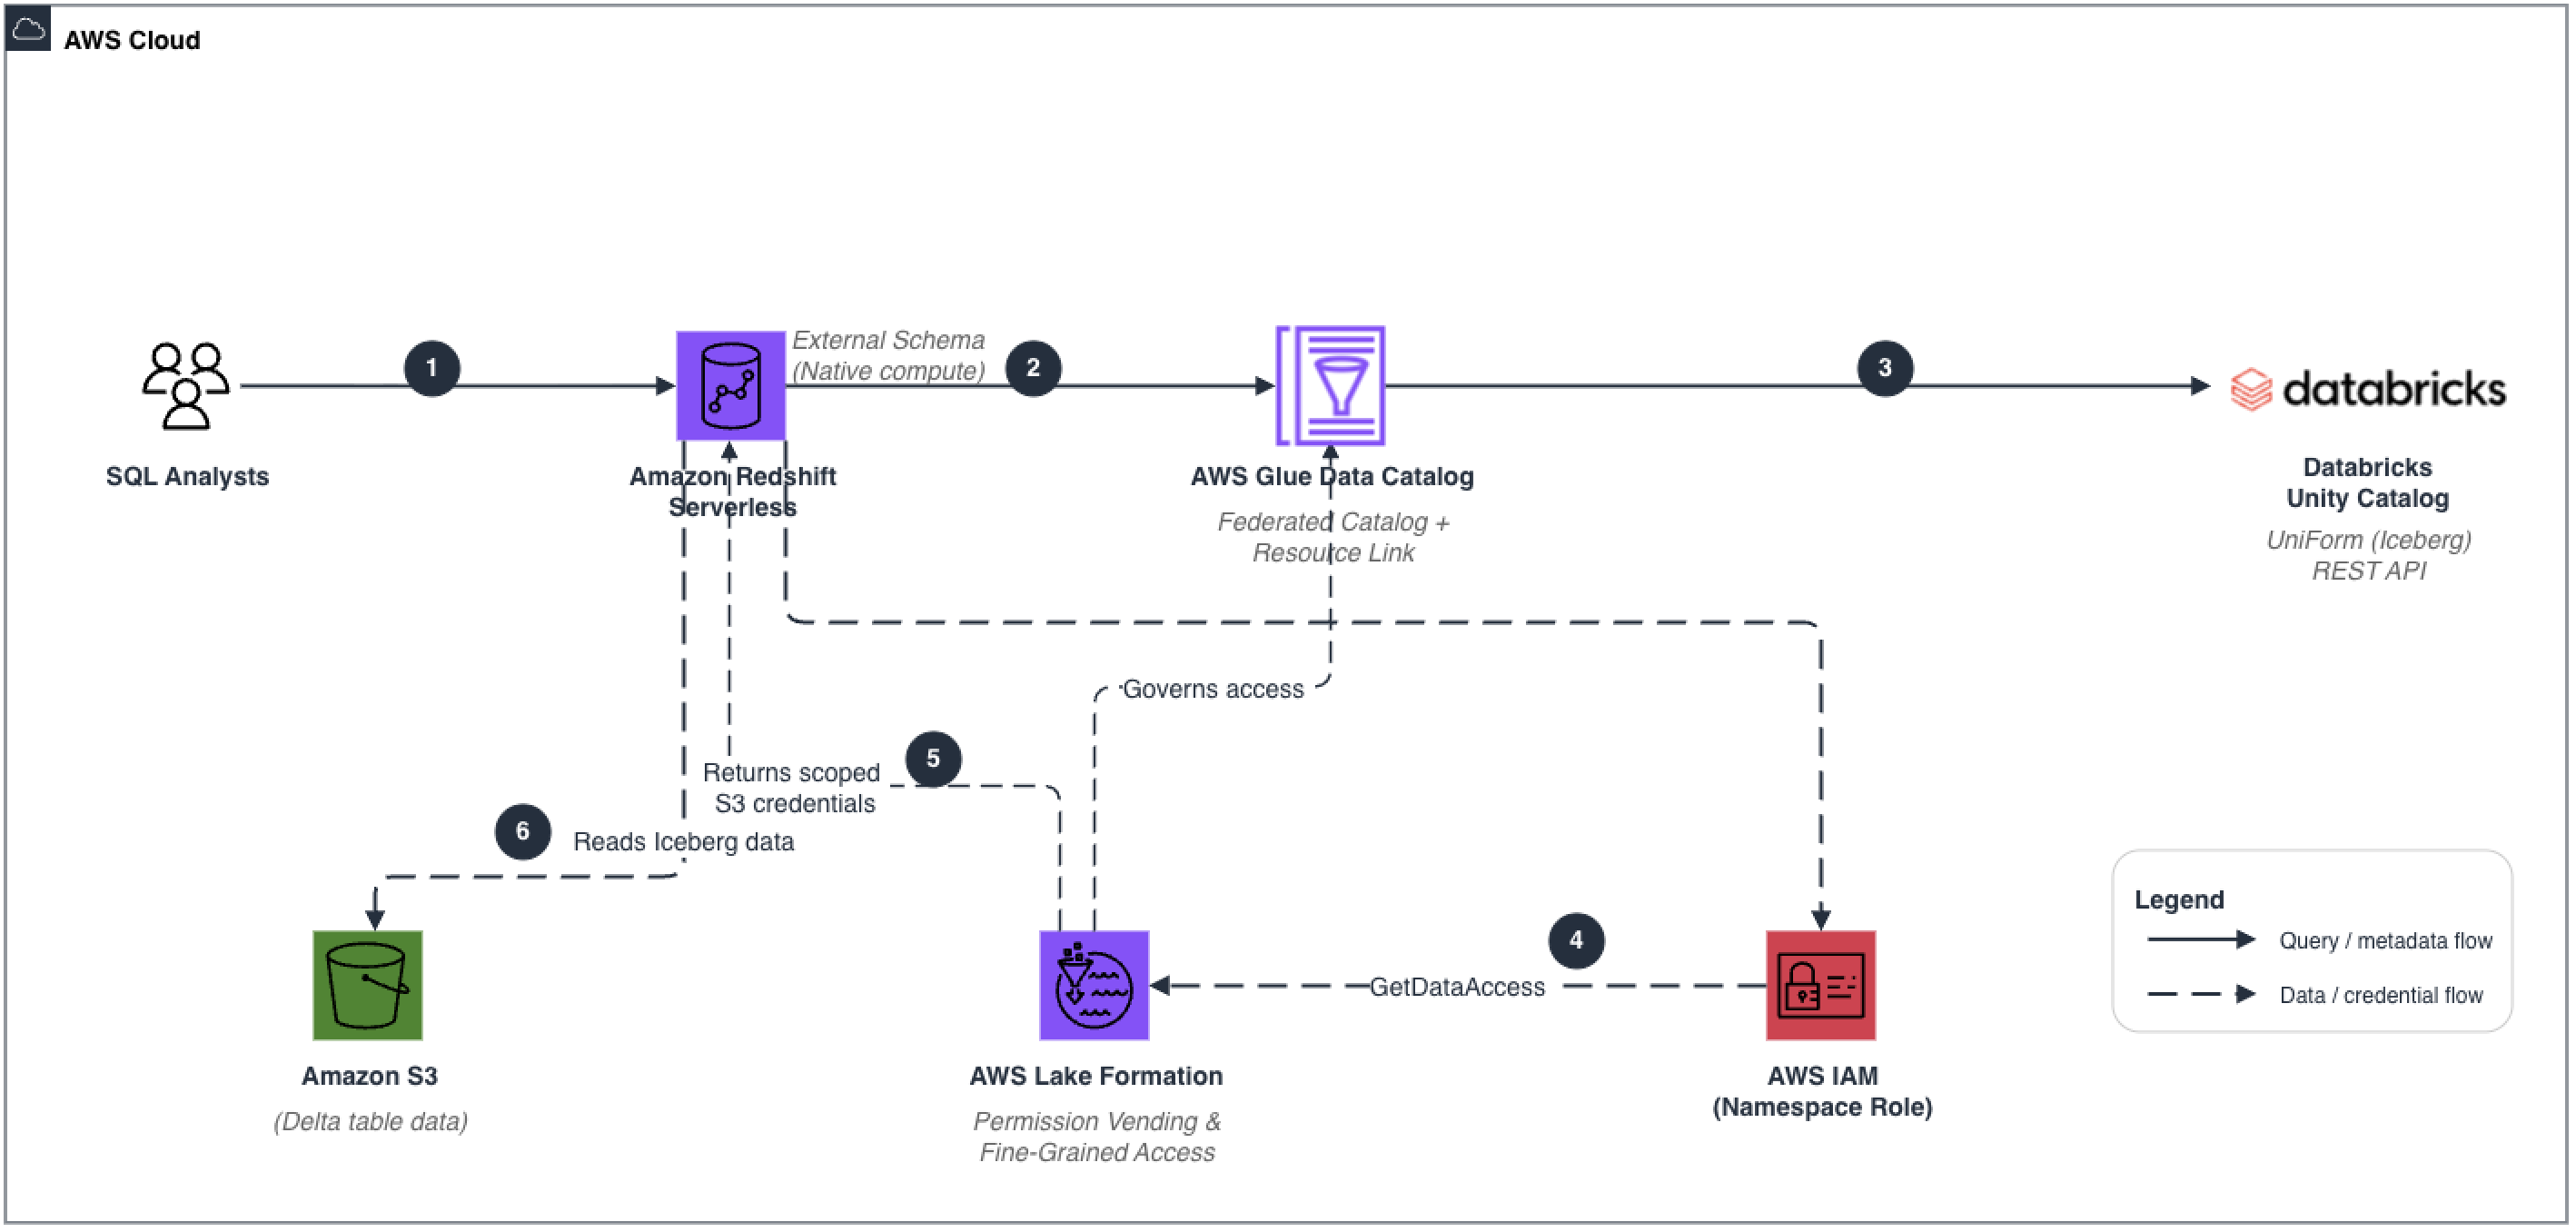
How United Airlines uses Amazon Redshift and AWS Glue Data Catalog federation to query Databricks-managed data
Learn how United Airlines uses AWS Glue Data Catalog federation to query Databricks Unity Catalog data directly from Amazon Redshift Serverless without duplicating data, using resource links and AWS Lake Formation for governance.
Open AI, Anthropic, Google have been in talks on AI safety for weeks
OpenAI confirms weeks of AI safety talks with Anthropic and Google DeepMind, as Trump's team dismisses safety concerns and pushes to keep pace with China.
Nvidia CEO Puts Trump on Phone While Downplaying AI Risk
Nvidia CEO Jensen Huang took a live phone call from Donald Trump during a panel discussion, allowing the US president to dismiss artificial intelligence dangers as a “hoax." Bloomberg's Tom Mackenzie reports. (Source: Bloomberg)
Scaling Federated Learning Across Docker, Kubernetes, and Slurm with NVIDIA FLARE
Federated learning (FL) projects often begin with a straightforward setup: one server, a few clients, and one dataset at each site. As those projects grow, the...
Open AI Says It’s Working With Anthropic, Google on AI Safety
OpenAI is working on steps to address artificial intelligence safety issues with its top competitors Anthropic PBC and Google DeepMind, escalating industry efforts to respond to a groundswell of concern that the technology poses an economic and security threat.
Early Anthropic hire, former METR COO have found a way to rein in rogue AI agents
Their startup, Artificial Intelligence Underwriting Company (AIUC) has raised $40 million in a Series A round led by Ribbit Capital, with participation from First Harmonic.